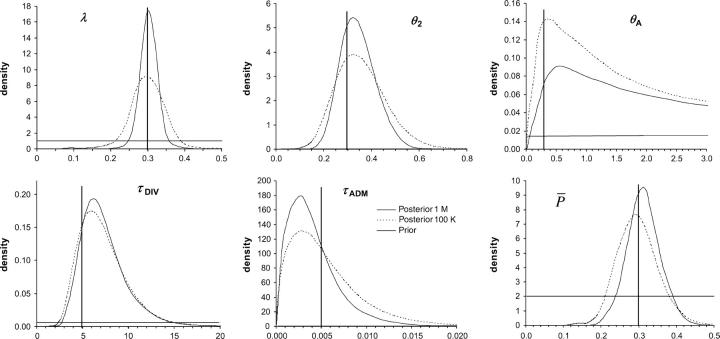
Figure 3.—
Posterior distributions of some parameters of the admixture model. We contrast here posterior distributions obtained from an analysis performed on a set of 1 million (solid line) or 100,000 (dashed line) simulated summary statistics. In both cases, the estimation and the posterior distribution were obtained by a local weighted regression (Beaumont et al. 2002) on the 1000 simulations closest to the test data set. True parameter values are shown as vertical boldface lines: N = 300 for all population sizes; admixture rate, λ = 0.3; divergence time between populations, tDIV = 5000 generations; admixture time, tADM = 5; mutation rate,  ; and parameter of the geometric distribution of mutation steps,
  = 0.3. Note that the posterior distributions shown here are the output of a single (randomly chosen) analysis, and that they are not averaged over 100 replicates as reported in Tables 2–4.

