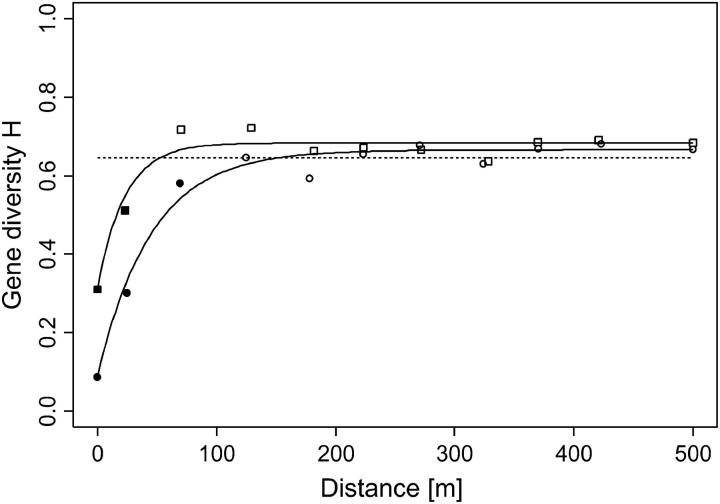
Figure 2.—
Variogram of gene diversity Ĥ(r) for a population of Lobaria pulmonaria. Each symbol denotes the mean semivariance over six microsatellite loci averaged over all pairs of thalli within each distance class. The semivariance is unweighted (circles) or weighted for recurrent genotypes (squares). The lines indicate the corresponding fitted exponential models; the dashed line shows the nonspatial model. Values below the dashed line correspond to positive, and values above the dashed line to negative, autocorrelation. Solid symbols indicate statistically significant positive autocorrelation based on a one-sided Mantel permutation test with progressive Bonferroni correction (α = 0.05).

