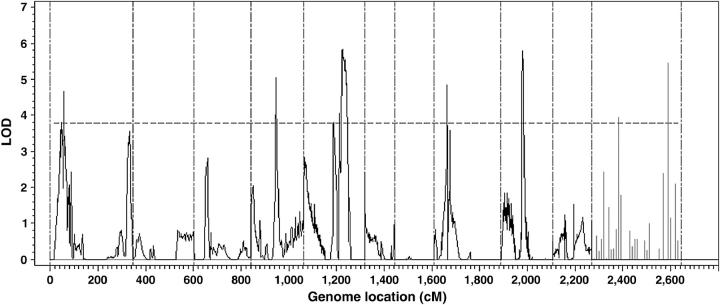
Figure 1.—
The LOD score profile of the maize genome scan. The genome is divided into 10 linkage groups (separated by the reference lines on the horizontal axis). The LOD scores of the 37 markers that have not been assigned to any of the linkage groups are plotted in the last block with 10 cM between consecutive markers.

