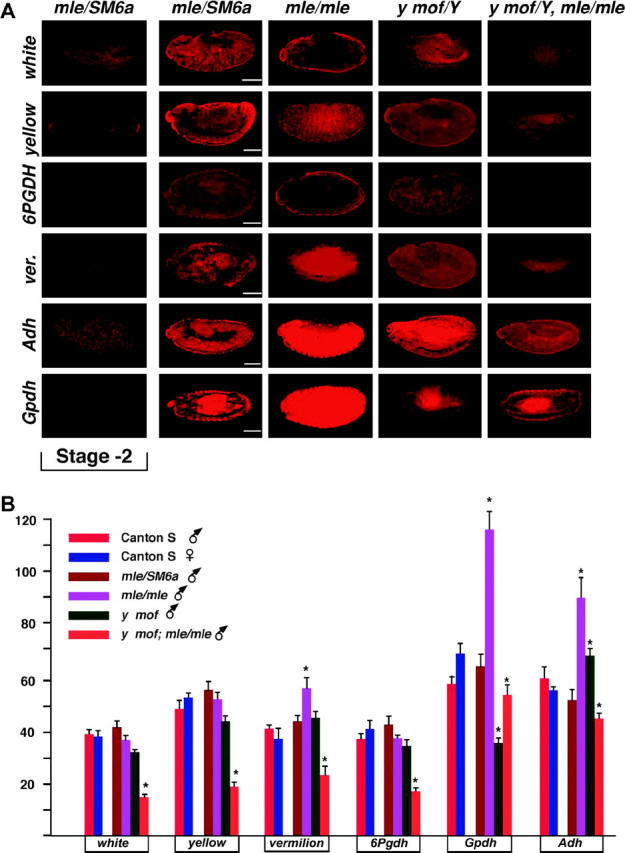
Figure 4.—

Embryo expression of the six selected genes analyzed. (A) A representative embryo at approximately stage 13 from each of the four male genotypes for each gene analyzed is shown. In addition, an early stage embryo is presented to illustrate the absence of maternal RNA. The sense mRNA determination represents the relative expression in each genotype. Probings for antisense RNA established the background hybridization. Bars, 50 μm. (B) Histogram of the gene expression in a population of embryos from Canton-S wild-type males and females as well as the mof/mle segregating population. Fifteen to 23 embryos were analyzed per genotype. Probing for antisense RNA served as the background for each gene, which was subtracted from the determination of each embryo. Those average values that differ from the normal male genotype at the 95% confidence level are marked by an asterisk.
