
Figure 3.—
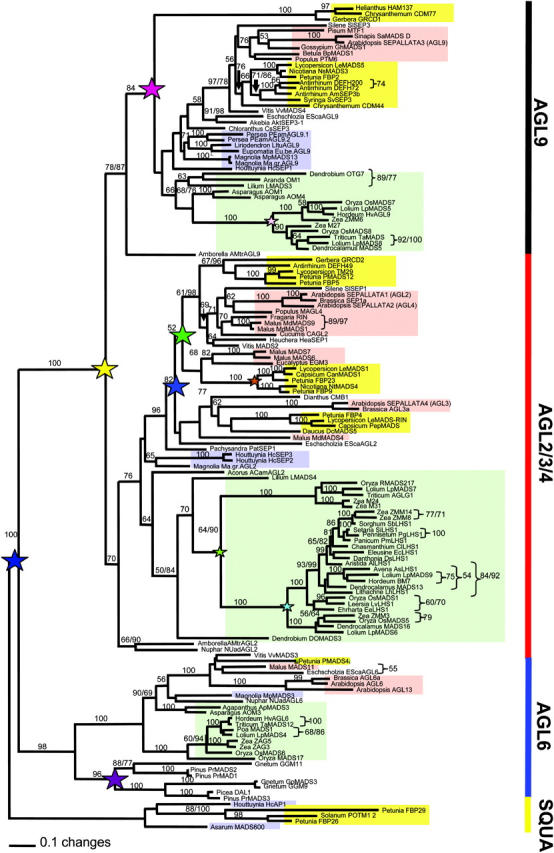
Maximum-likelihood tree of 113 representative SEP genes, 26 AGL6 genes, and 5 SQUA genes. Analyses and 250 bootstrap replicates were each performed with 100 random stepwise additions and TBR branch swapping, saving 10 trees per replicate of alignment I. Positions with two numbers indicate nodes where resulting maximum-parsimony bootstrap (250 bootstrap replicates, each with 100 random stepwise additions and TBR branch swapping, saving 10 trees per replicate) differed from the maximum-likelihood analyses by >5%. Stars indicate hypothesized gene duplication events; small stars represent duplication at a family level and large stars represent duplications at larger hierarchical levels. Note that the placement of the GRCD1 lineage near the base of the AGL9 clade appears to be spurious and that other analyses (supplemental Figures 2 and 3 at http://www.genetics.org/supplemental/) place this clade within the core eudicots. Background colors represent major angiosperm lineages: red, rosids; yellow, asterids; green, monocot; blue, magnoliid.