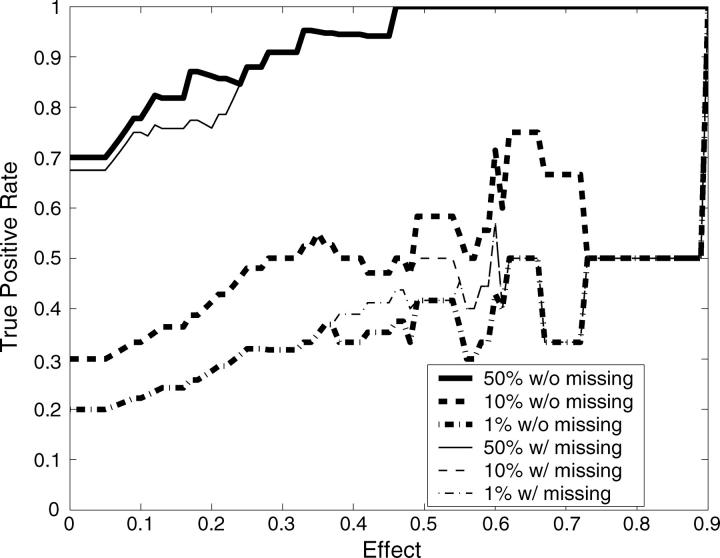
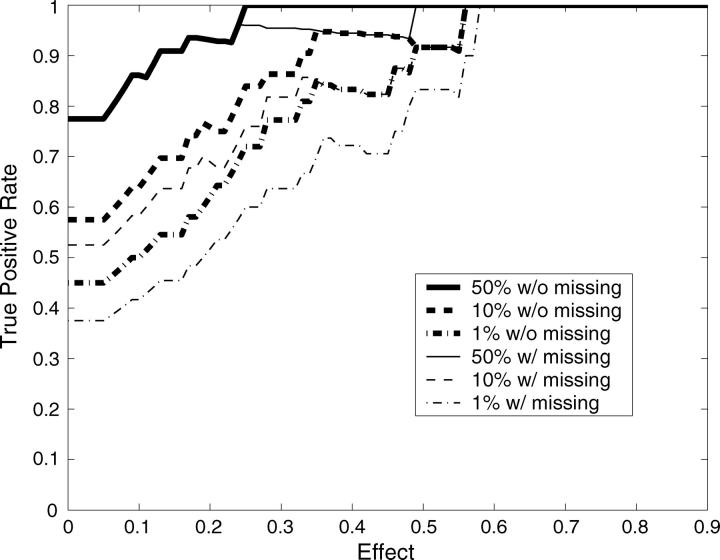
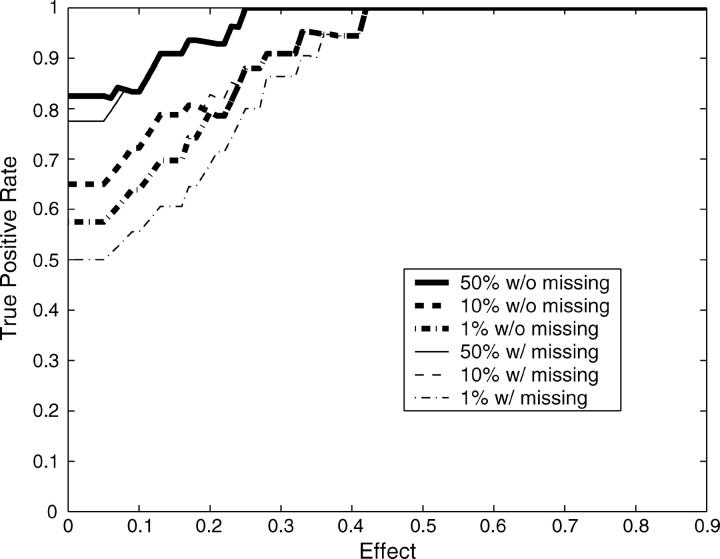
Figure 4.—
True-positive rate vs. effect size (α) at different heritabilities: h2 = 0.2 (top), h2 = 0.4 (middle), and h2 = 0.6 (bottom). The true-positive rates are calculated by counting only those QTL with effects higher than the given effect size (x-axis). The different lines refer to the different decision rules with and without missing data; 50%, 10%, and 1% refer to the percentiles of the posterior probabilities pj+ and pj− that were used as threshold values.


