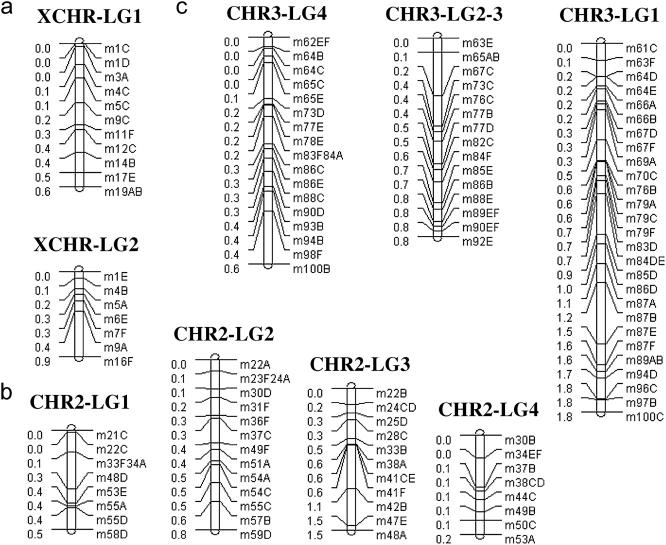
Figure 1.—
Linkage groups (LGs) reflecting the marker associations in parental haplotypes for the (a) XCHR, (b) CHR2, and (c) CHR3. Distances between markers reflect estimated recombination distances. Note that there are two XCHR LGs because the third had only three markers and there are only three CHR3 groups because two (LG2–3) had most markers in common.

