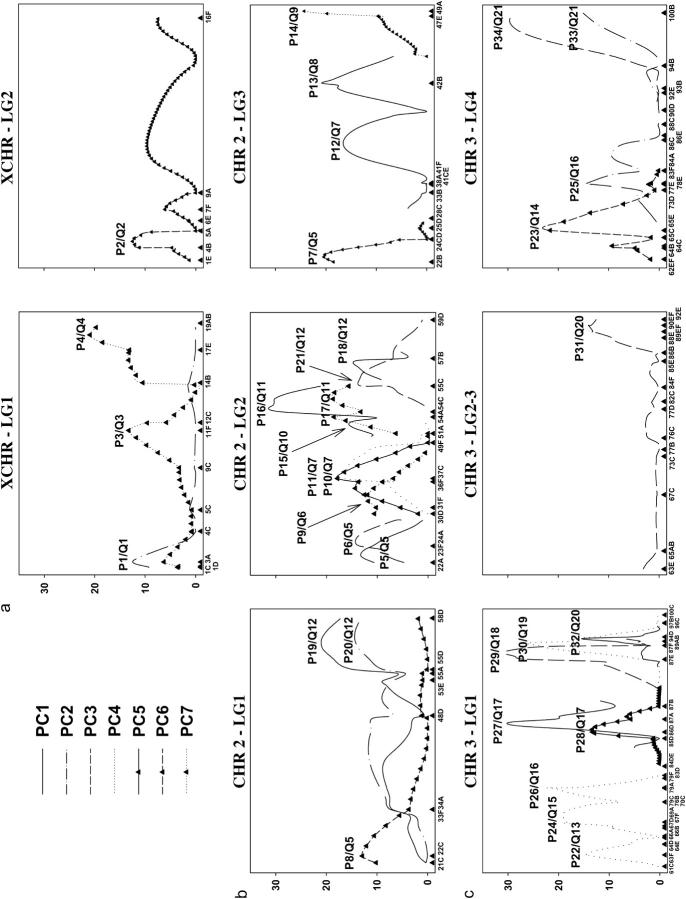
Figure 3.—
Likelihood-ratio profiles (y-axis) vs. the linkage groups (x-axis) of the (a) XCHR, (b) CHR2, and (c) CHR3. Significant peaks are labeled as P#/Q#, where P# is the peak number and Q# reflects distinct putative QTL (Table 2). Note there were no significant peaks for LG of CHR2 so this LG is not shown.

