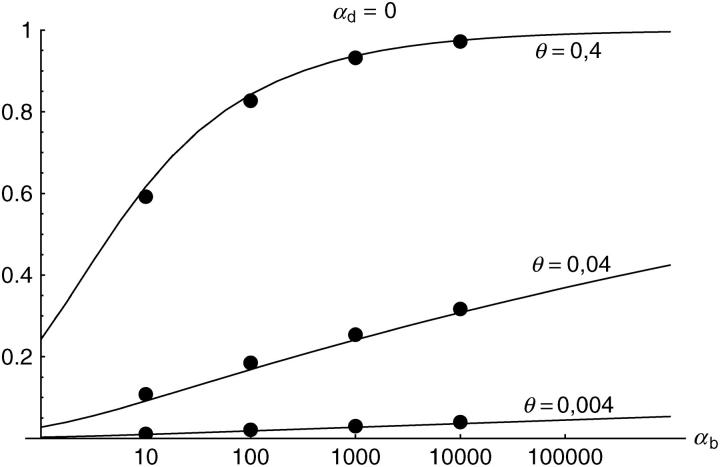
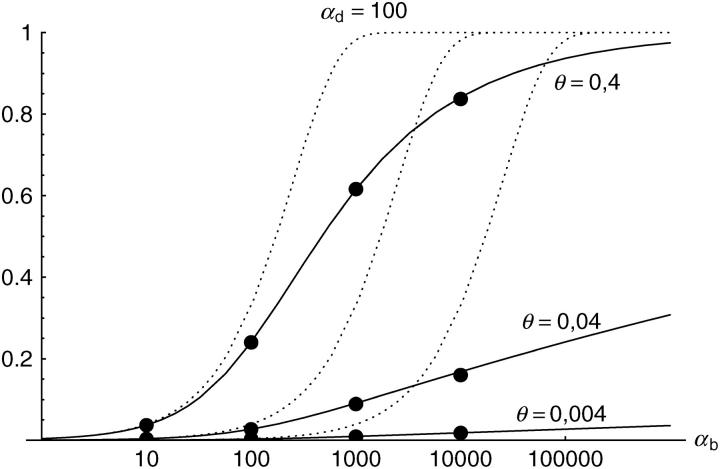
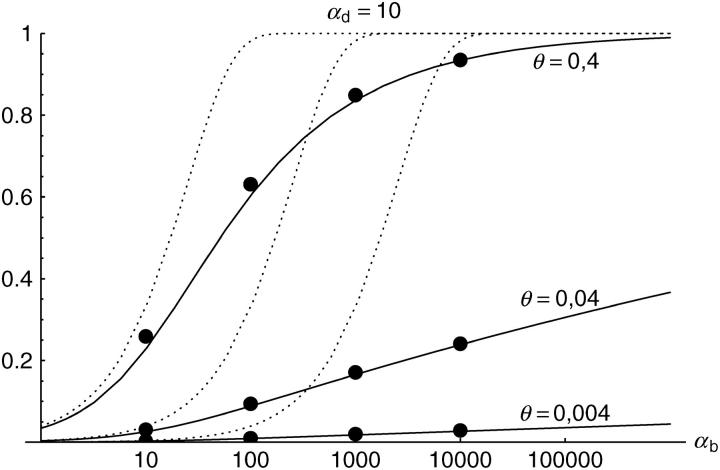
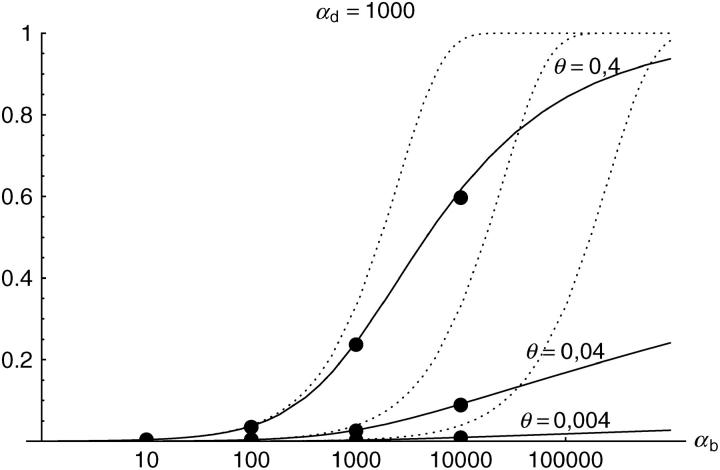
Figure 2.—
The probability of fixation from mutation-selection-drift balance, Psgv, for a range of mutation and selection parameters. Solid lines show approximation Equation 8 and dotted lines show the deterministic approximation Equation 10. Solid circles are simulation results. Ninety-five percent confidence intervals are contained in the circles.


