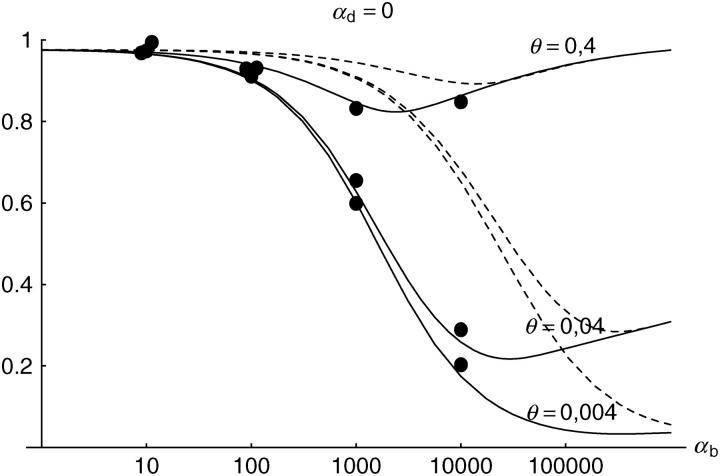
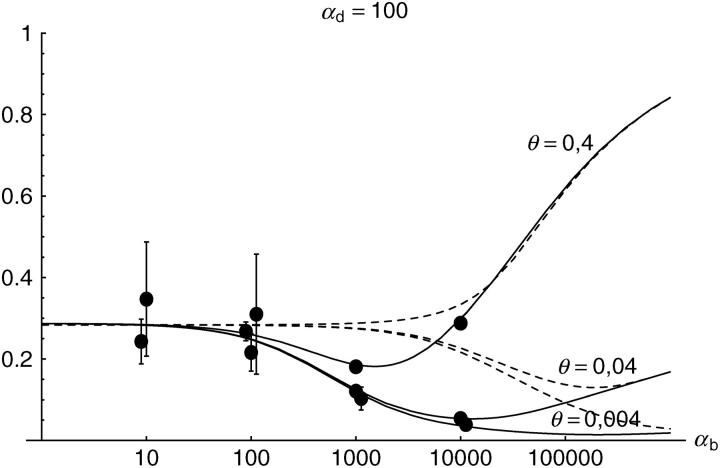
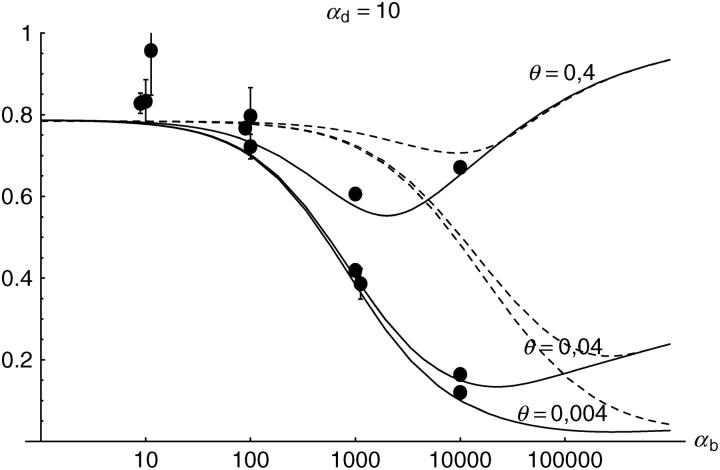
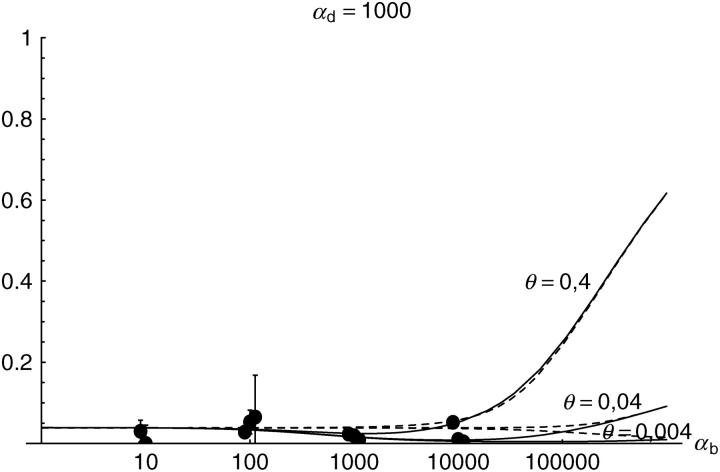
Figure 4.—
The probability that an adaptive substitution stems from the standing genetic variation Prsgv in a population with a bottleneck at the time of the environmental change. Dashed lines show a simple reduction in population size by a factor 100 without recovery. Simulation circles and solid lines are for the opposite case of strong logistic recovery (for parameters see main text). The lines follow from the simple analytical approximation Equation 14 with the bottleneck correction Rα → Rα/Bsgv and αb → αb/Bnew in the term proportional to G. Direct numerical integration of Equations 5 and 6 with the same bottleneck correction produces a slightly better fit.


