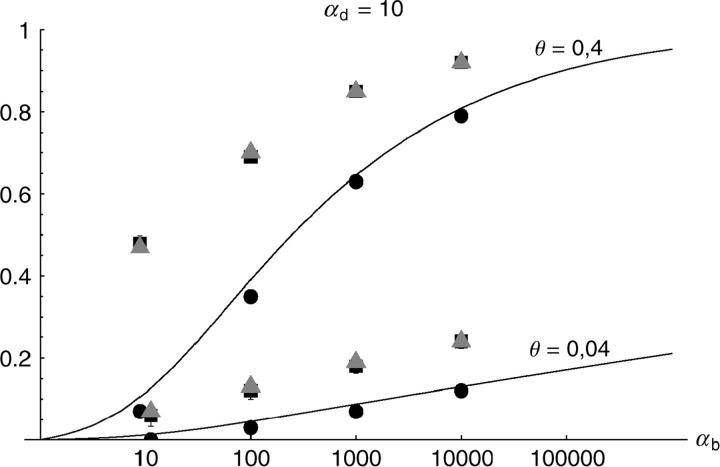
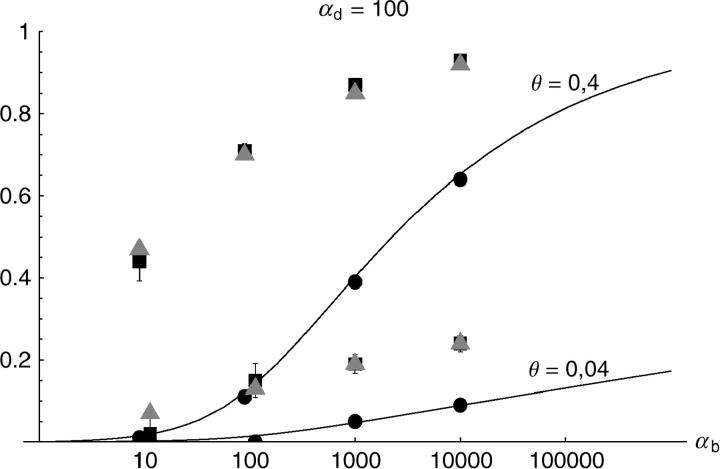
Figure 6.—
The probability that multiple copies with independent origin contribute to a substitution, Pind. Lines correspond to Equation 20; symbols represent simulation data. Circles represent fixations from the standing genetic variation without new mutational input after time T; squares include new mutations. Triangles represent fixations from recurrent new mutations only.


