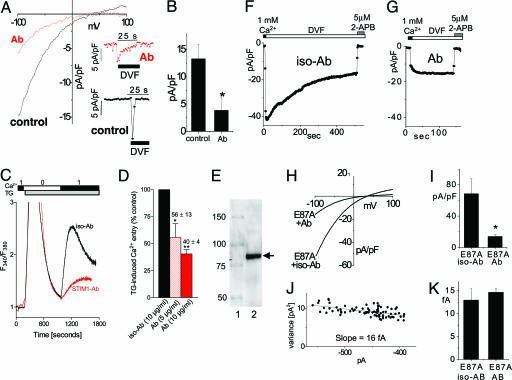
Fig. 4.
ICRAC and store-operated Ca2+ entry were inhibited by an anti-N-terminal STIM1 (25–139) mAb. Ab is depicted in red, and control (with or without isotype Ab) is depicted in black. (A–J) Jurkat T cells (A and B), HEK293 cells (C and D), or rSTIM1 knockdown RBL cells reexpressing hSTIM1 E87A mutant (F–K) were incubated for 30–60 min with STIM1 mAb or IgG2a isotype control Ab. (A) I–V curves for ICRAC were measured in DVF after maximal activation in Ca2+ in the presence or absence of 20 μg/ml mAb. Current inhibited by mAb was similar to control with respect to inward rectification and reversal potential. (Inset) Time course of ICRAC at −80 mV, measured after maximal activation. (B) Average maximal current measured at −100 mV was decreased by ≈70% in the presence of 20 μg/ml mAb compared with control (n = 3; P < 0.05). (C) SOC-mediated Ca2+ entry assessed in fura-2/acetoxymethyl ester-loaded HEK293 cells was similarly inhibited by the same mAb. No Ca2+ entry was observed with transient Ca2+ addition before 2 μM TG addition. Addition of Ca2+ after TG-induced store depletion revealed a reduction in SOC-induced Ca2+ entry in mAb-pretreated cells. (D) The effect of mAb on SOC was dose-dependent: ≈45% (P < 0.05) reduction at 5 μg/ml and ≈60% (P < 0.01) reduction at 10 μg/ml. (E) Western analysis of Jurkat T cell lysate using the same STIM1 mAb revealed only a single major band corresponding to the STIM1 protein. Lanes: 1, Size standards (kDa); 2, Jurkat T cell lysate. (F–K) ICRAC in hSTIM1 E87A-reexpressing RBL cells after rSTIM1 knockdown was inhibited by STIM1 Ab. (F) Incubation in isotype control Ab did not induce a change in ICRAC compared with control cells (Fig. 3E). (G) Incubation with mAb reduced ICRAC. Subsequent addition of 5 μM 2-APB resulted in complete blockade of the remaining current. (H) I–V curves of the cells shown in F and G in DVF were similar in inward rectification and reversal potential. (I) Average maximal current measured at −100 mV was decreased by ≈80% in the presence of mAb (n = 3; P < 0.05). (J) Noise analysis of the cell in G showed a preserved single-channel current of 16 fA, typical for ICRAC. (K) No change in the single-channel conductance was observed for the residual current after the mAb block (n = 3), compared with the isotype control (n = 3).

