Fig. 4.
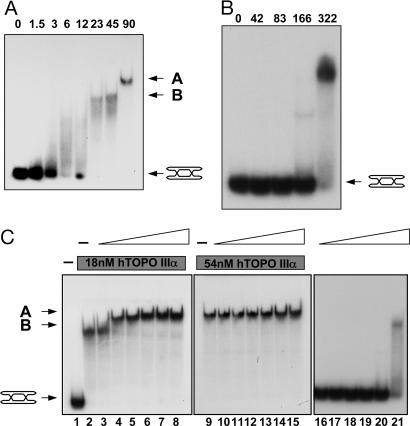
hRMI1 promotes hTOPO IIIα binding to DHJ. (A) EMSAs using DHJ and various concentrations of hTOPO IIIα as indicated. Positions of protein–DNA complexes, designated A and B, and the unbound DHJ substrate are indicated on the right. (B) EMSAs using DHJ and various concentrations of hRMI1 as indicated. The position of the unbound DHJ substrate is indicated on the right. (C) EMSAs using DHJ, two fixed concentrations of hTOPO IIIα, as indicated by the gray bars (lanes 2–8 and 9–15), and a 3-fold dilution series of hRMI1 (highest concentration of 256 nM), as indicated by the white triangles (lanes 3–8, 10–15, and 16–21). Positions of protein–DNA complexes, designated A and B, and the unbound DHJ substrate are indicated on the left.

