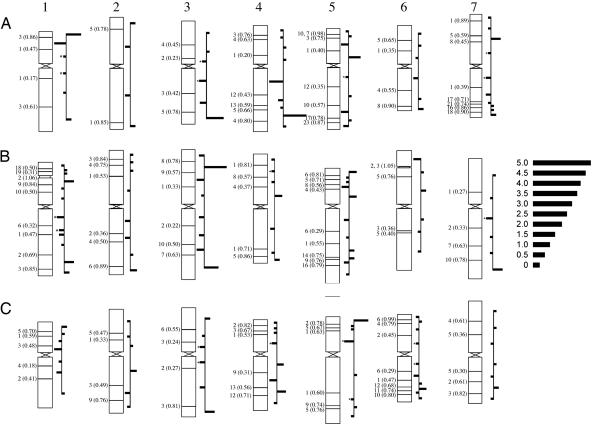
Fig. 4.
Distribution trend in NSH wESTs in deletion bins along chromosome arms. Bars represent negative log10 of P values resulting from a χ2 test for each bin that tested the null hypothesis that the proportion, with respect to that chromosome arm, of NSHs mapping to that bin is equal to that of all ESTs mapping to that bin. Bars extend to right for bins in which NSH frequency exceeds expectation and to left for those in which it is lower than expectation (asterisks indicate that the bin contained no observed NSHs).

