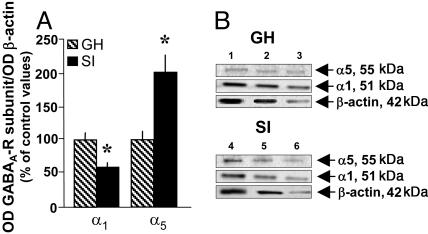
Fig. 5.
GABAA-R α1 and α5 subunit protein expression in the frontal cortex of 4-week SI and GH mice. (A) Mean values ± SEM of α1 and α5 subunit proteins, n = 5. (For α1, t8 = 2.91; and α5, t8 = 3.00; ∗, P < 0.05 vs. GH mice, Bonferroni t test. Mean ± SEM of five mice.) (B) A typical Western immunoblot of α1 and α5 in a SI mouse and a GH mouse. Lanes 1–3, serial dilutions of a GH frontal cortex extract; lanes 4–6, serial dilution of a frontal cortex SI extract.

