Fig. 6.
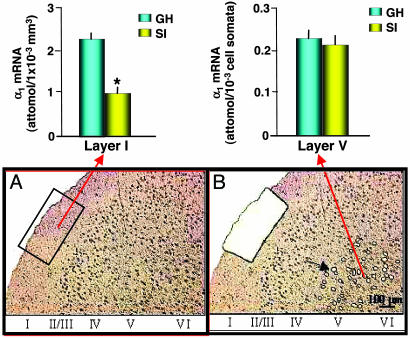
Quantitative nested RT-PCR assay of α1 subunit mRNA in layers I and V of mouse frontal cortex; comparison between 4-week SI and GH mice. (Upper) GABAA-R α1 subunit mRNA expression in layer I, including GABAergic interneurons and neuropil (Left), and layer V pyramidal neurons (Right) microdissected as described in Materials and Methods. (Layer I: t6 = 5.25; ∗, P < 0.01 vs. GH mice, Bonferroni t test. Mean ± SEM of four mice.) (Lower) Illustrations of layers I and V dissected with laser-assisted microscopy. In A, the rectangular box indicates the area to be dissected from layer I neuropil. B shows the space remaining after a portion of layer I is dissected, and the black arrow in layer V points to dissected pyramidal neuronal somata (open circle). Note the almost complete absence of toluidine blue-stained nuclei in layer I.

