
Figure 2.—
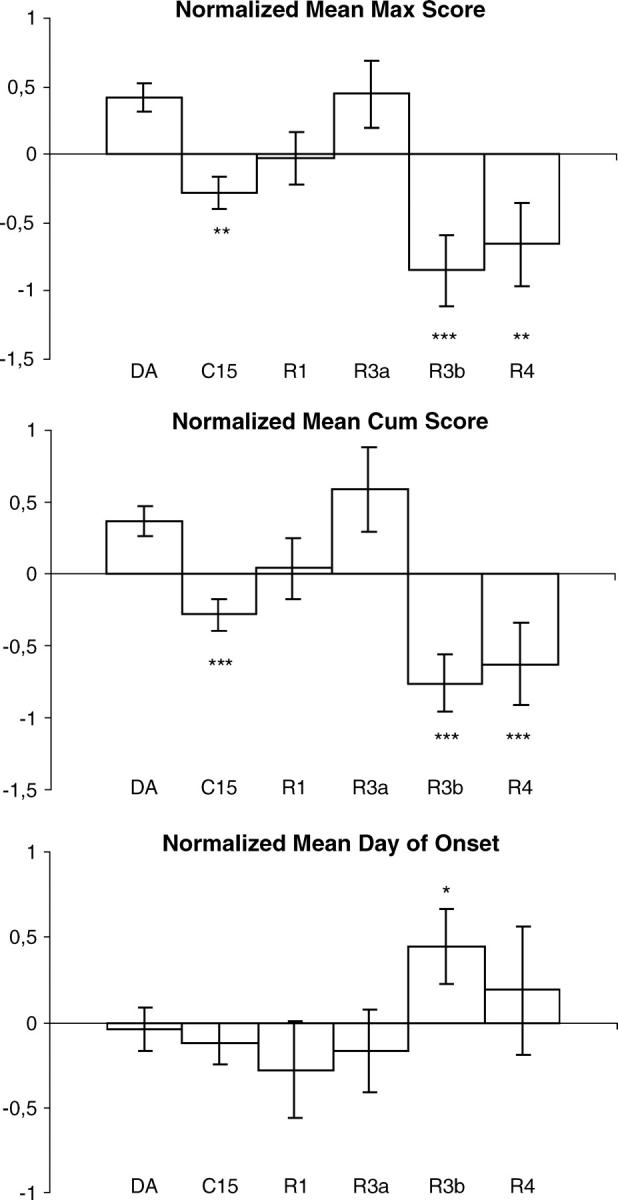
Combined analysis of the clinical MOG-EAE phenotypes in six separate experiments encompassing the DA (n = 72), C15 (n = 49), C15R1 (n = 23), C15R3a (n = 9), C15R3b (n = 14), and C15R4 (n = 17) strains. Maximum EAE score, cumulative EAE score, and onset day were tested with the Wilcoxon two-sample test after normalization; *P < 0.05, **P < 0.01, and ***P < 0.001. Pairwise comparisons were made with the congenic strains and the DA strain. Mean values and SEM for disease onset day after immunization were calculated only for affected rats.