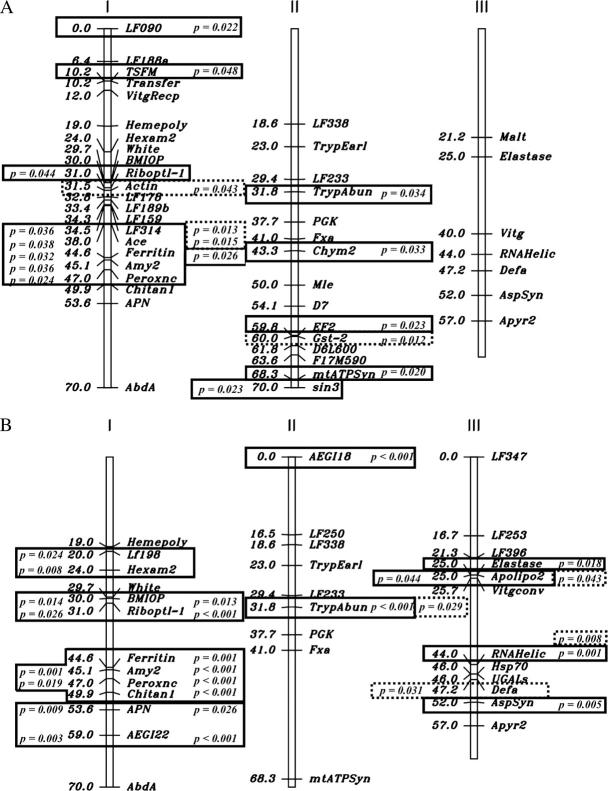
Figure 1.—
Linkage maps of the Aedes aegypti (A) D2S3 × D2MEB 2.2 and (B) D2MEB × D2S3 7.1 families. The linkage positions of all marker loci are published (Severson et al. 2002; Black and Severson 2004). The results of χ2-goodness-of-fit tests indicate when marker genotypes were not distributed independently of infection phenotypes. Loci that are statistically associated with a disseminated infection appear in boxes containing the associated type I probability and those with a midgut infection appear in dotted-line boxes. Values to the left and right of the chromosomes are from analysis of the F2 and F5 offspring, respectively.

