
Figure 7.—
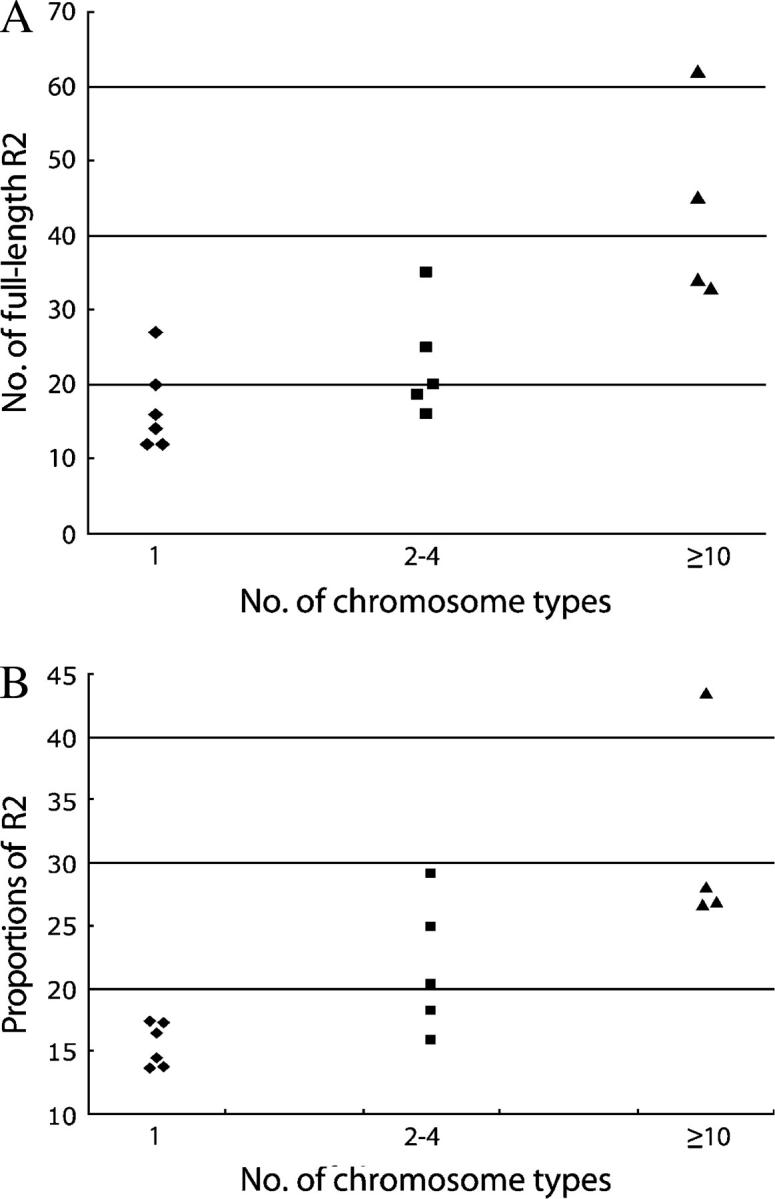
Correlation between R2 activity and the number of full-length R2 elements or the fraction of the rDNA locus inserted with R2. The level of R2 activity was scored as the level of variation within each line (i.e., the number of X chromosome variant profiles from Figure 3). The Paradise lines are divided into three groups on the basis of the number of chromosome types found in sampled males from that line and plotted vs. (A) the number of full-length R2 elements found in the Paradise lines and (B) the fraction (as percentage) of the rDNA units in each line inserted with R2.