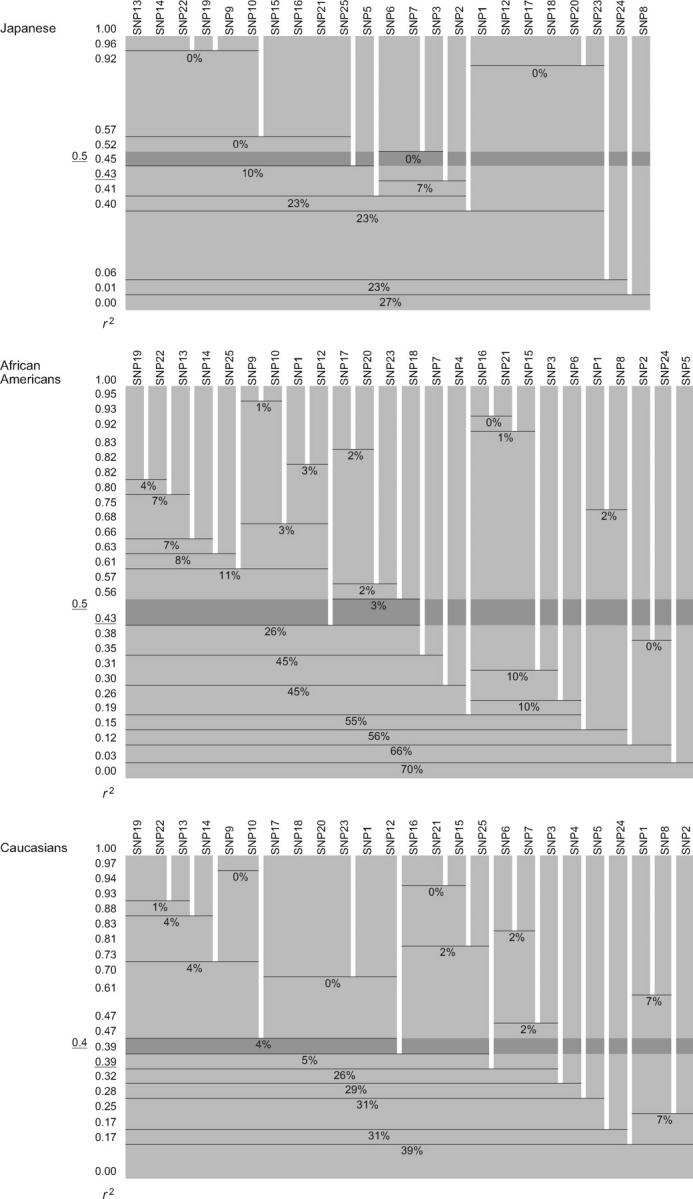
Figure A1.—

SNP classification by LD groups against various r2 thresholds in the LPL gene in three ethnic populations. For any r2 threshold between zero and one, locate its position in the vertical axis. The SNP classification by LD groups against a given threshold is at its right on the horizontal axis: the SNPs classified in the same LD group are placed together in a single shaded rectangle. Each rectangle outlined by two horizontal lines corresponds to an LD group, and the sum of the frequencies of rare haplotype classes (see step 6 of the tag SNP selection algorithm) is indicated as a percentage within the rectangle. Since the sum for LD groups against the r2 threshold of one (e.g., a group of SNP13, SNP14, and SNP22 in the Japanese) is always 0%, the sum is not denoted for such cases. The average of the sums across a series of LD groups against the r2 threshold value becomes the “total frequency of neglected haplotype classes” (see step 6). Note that even for this continuous range of the r2 thresholds, there are only finite possibilities for classification by LD group. As the r2 threshold decreases, separate clusters of SNPs are combined and form a larger LD group. Overall, the sum of the frequencies of rare haplotype classes for combined LD groups tends to become larger than that for separate clusters of SNPs. The optimal threshold value, t, in the original tag SNP selection algorithm is underlined at the far left, and the resultant classification by LD groups is indicated by dark shading (see also Figure 3). The optimal threshold for the continuous version (see appendix) is also underlined in the immediate left.
