
Figure 7.—
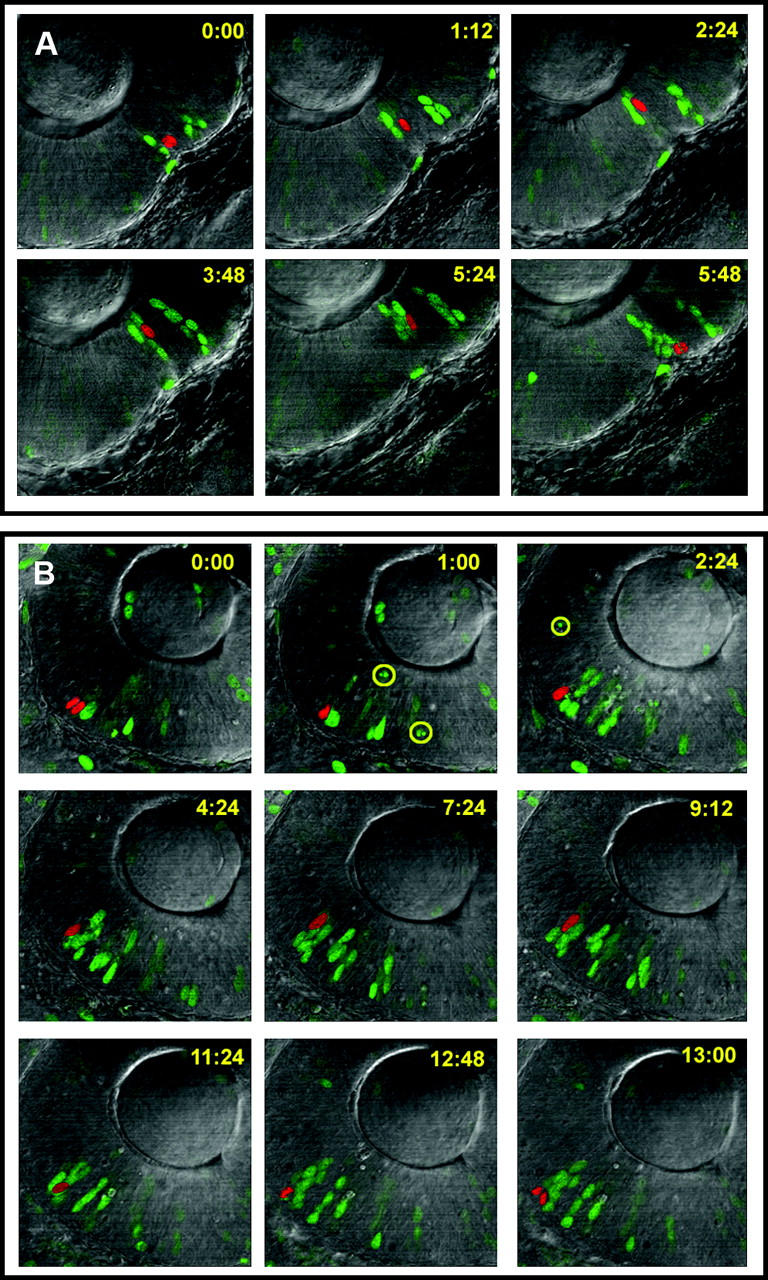
Confocal time-lapse analysis of retinal cell cycle dynamics. (A) Wild-type and (B) perplexed retinal progenitors are shown. The red pseudo-colored cell expressed histone H2B:::GFP and can be seen to enter mitosis in the top left (time 0:00). Representative images are shown throughout the cell cycle. Green cells, also labeled with histoneH2B:::GFP, were followed by separate analyses. Yellow numbers show time in minutes from the first imaged M-phase. The lens is located in the top half of each image and the ventricular zone at the retinal pigment epithelium is toward the bottom (pigmentation was inhibited with PTU). Apoptosis can be seen occurring in some labeled cells in the perplexed retina (highlighted by yellow circles). Nonlabeled cells dying are also visible by their pyknotic profiles.