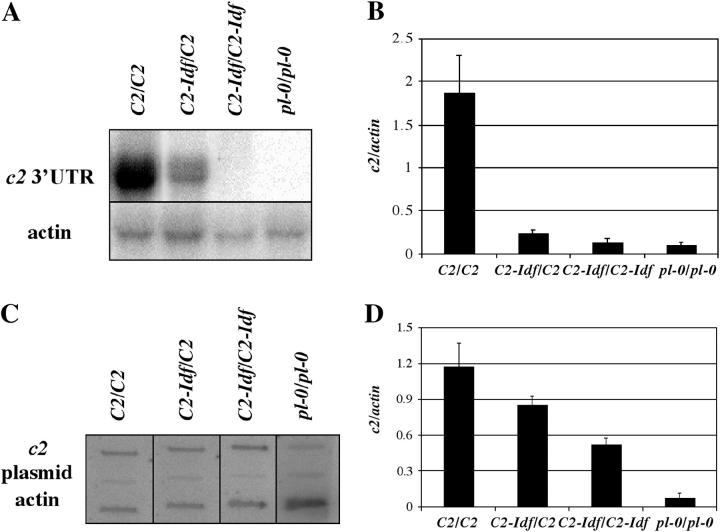
Figure 5.—
RNA levels in C2-Idf mutants. (A) Representative RNA blot probed with the C2 3′-UTR. The blot was stripped and rehybridized with an actin probe as a loading control. (B) Relative steady-state c2 transcript levels normalized against actin (n = 6–8; error bars are the standard errors of the means). (C) Representative slot blots probed with radioactively labeled nuclear RNA. (D) Relative transcription rate normalized against actin (n = 6; error bars represent the standard errors of the means).

