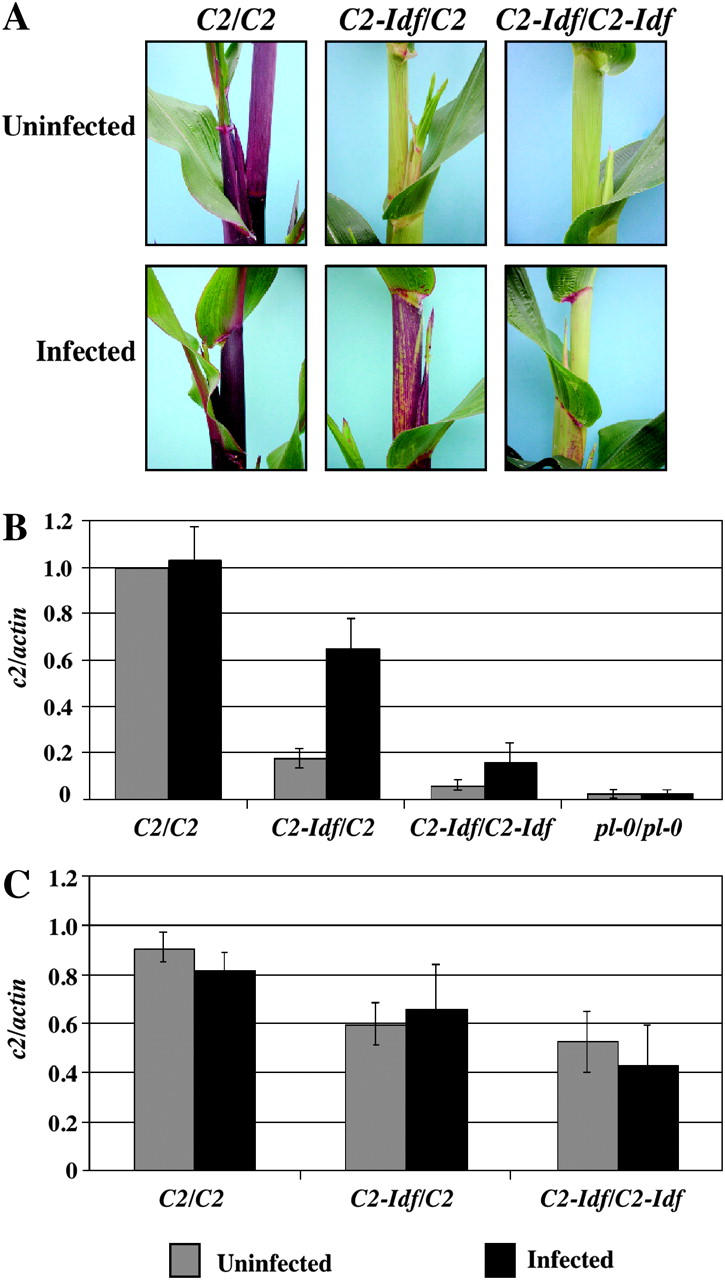
Figure 7.—

The effect of infection with MDMV-A on C2-Idf silencing. (A) Phenotypes of uninfected control plants (top) and MDMV-A-infected plants (bottom). (B) Steady-state c2 transcript levels normalized against actin (n = 6–8; error bars are the standard errors of the means). (C) Relative c2 transcription rate was measured by run-on transcription assays of infected plants and uninfected controls (n = 3, error bars are the standard errors of the means).
