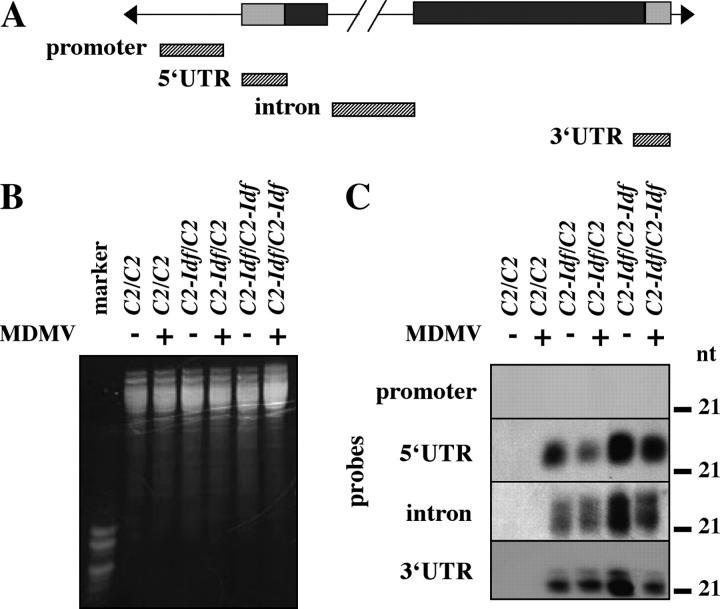
Figure 8.—
siRNA analysis from plants infected with MDMV-A. (A) Diagram of the c2 gene showing location of hybridization probes (hatched boxes). Shaded boxes represent untranslated regions; solid boxes represent protein-encoding regions. (B) Ethidium bromide-stained image of RNA gel to show comparable loading in all lanes. (C) RNA blots hybridized with probes from A. RNA was isolated from MDMV-A-infected plants (+) and uninfected controls (−). Position of 21-nt size standard in gel is indicated to the left of each blot.

