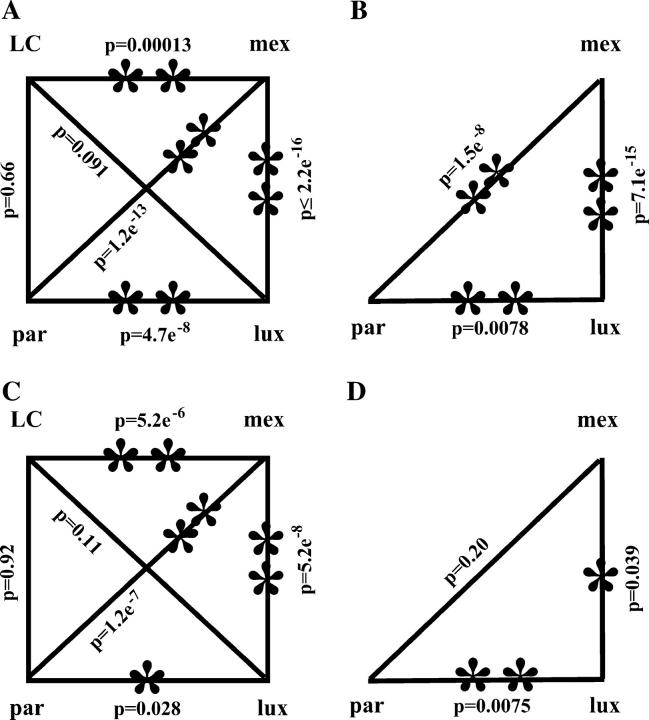
Figure 1.—
Comparisons of recombination rates per megabase and distributions of recombination breakpoints among stocks that carry different A1 Sh2 haplotypes. (A) Rates of recombination per megabase between the al and sh2 loci. (B) Distributions of recombination breakpoints across the al-sh2 interval. (C) Distributions of recombination breakpoints across the a1 locus (subintervals I–II). (D) Distributions of recombination breakpoints across the yz1 locus (subinterval IV). Rates and distributions were compared via χ2 tests and P-values are indicated. Statistically significant differences are indicated by asterisks. (*) Significant difference at the 0.05 level; (**) significant difference at the 0.01 level. Although the LC haplotype in A and C are identical by descent, they were analyzed in different genetic stocks (A, LC2; C, LC1; materials and methods). Comparisons in D did not include recombinants that resolved in subinterval V-1 (Figure 4) because the sizes of this subinterval vary too much among haplotypes to permit fair comparisons. The distribution of breakpoints across the yz1 gene considered only the transcribed region (subinterval IV).

