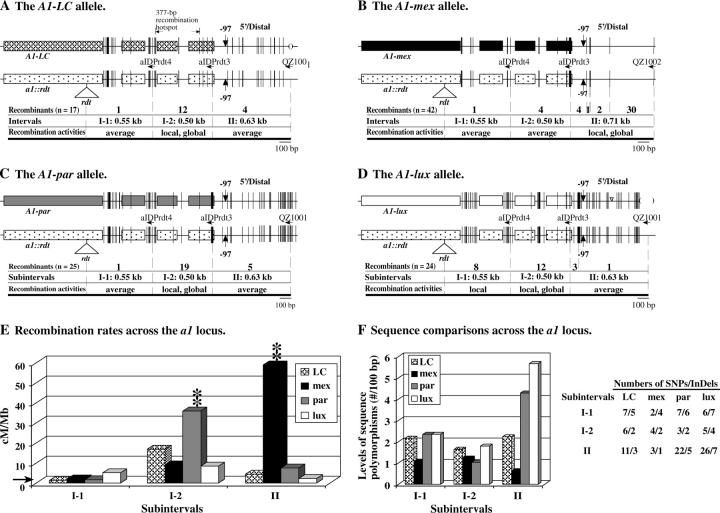
Figure 3.—
High-resolution mapping of the recombination breakpoints that resolved in the a1 locus of the LC, mex, par, and lux haplotypes. (A–D) Exons of the a1 gene are shown as boxes. Short vertical lines represent sequence polymorphisms between A1 alleles and the a1::rdt allele. The widths of the vertical lines are proportional to the numbers of polymorphic nucleotides. Subintervals are defined by sequence polymorphisms. Haplotype-specific primers are indicated by horizontal arrows. The numbers of recombination breakpoints that mapped to each subinterval for each haplotype are shown. Each interval is classified as being an average recombination spot (average), a local recombination hot spot (local), or a local and global recombination hot spot (local, global; see legend of Table 3 for definitions). Large InDeLs are indicated by triangles (insertions) and parentheses (deletions). (A) The positions of recombination breakpoints previously characterized by Yao et al. (2002), but here classified relative to subintervals I-1 and I-2. (E) Comparison of recombination rates per megabase across the a1 locus among the LC, mex, par, and lux haplotypes. The horizontal arrow indicates the average recombination rate per megabase of the maize genome (2.1 cM/Mb). (**) indicates that the recombination rate per megabase in the labeled haplotype in the corresponding subinterval is significantly different from all others at the 0.01 level. (F) Comparison of levels of sequence polymorphisms (no./100 bp) at the a1 locus among the LC, mex, par, and lux haplotypes. Sequence polymorphisms are between each A1 Sh2 haplotype and the a1::rdt sh2 haplotype. Numbers of SNPs/InDeLs in each subinterval are also listed.

