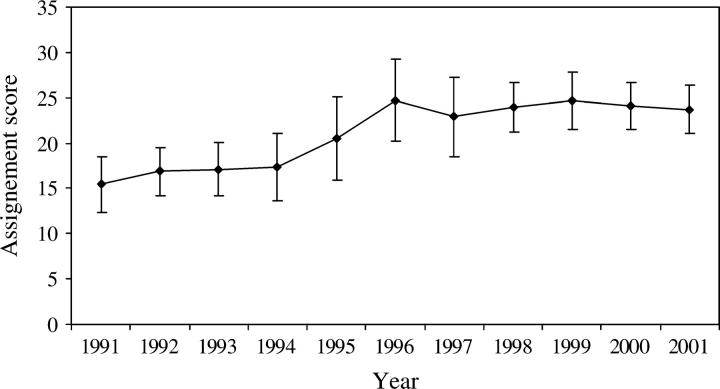
Figure 7.—
Average assignment scores and their standard deviations for the temporal WWR population sample. Using the Bayesian method, individual honeybees were assigned to one of the five reference samples (European, Brazilian, simulated European backcross, simulated F1, and simulated Brazilian backcross). For each individual honeybee, the average value was obtained from 100 data sets of the simulated reference samples of 50 individuals each.

