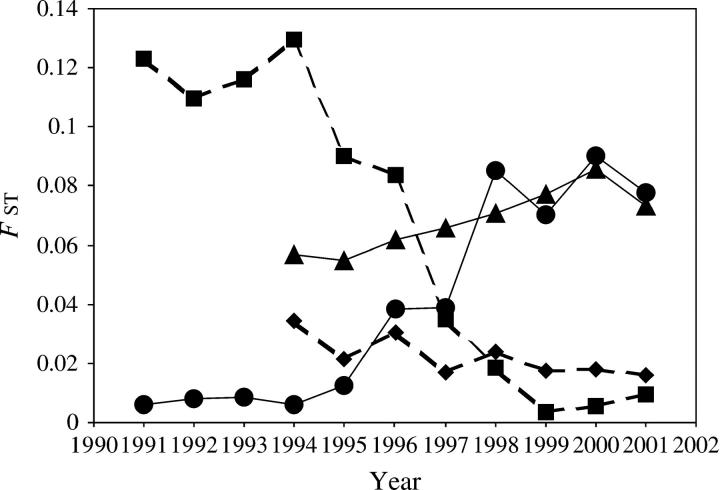
Figure 9.—
Temporal pattern of multilocus FST values. The FST values were computed between the reference Brazilian (Braz) and European (Eur.) population samples and the WWR subsamples separated by mitotype (A. m. scutellata vs. non-A. m. scutellata). It should be noted that no FST value was calculated for 1993 because the A. m. scutellata mitotype subsample was composed of a single individual. (▪) Braz. vs. WWR with non-A. m. scutellata mitotype, (♦) Braz. vs. WWR with A. m. scutellata mitotype, (•) Eur. vs. WWR with non-A. m. scutellata mitotype, (▴) Eur. vs. WWR with A. m. scutellata mitotype.

