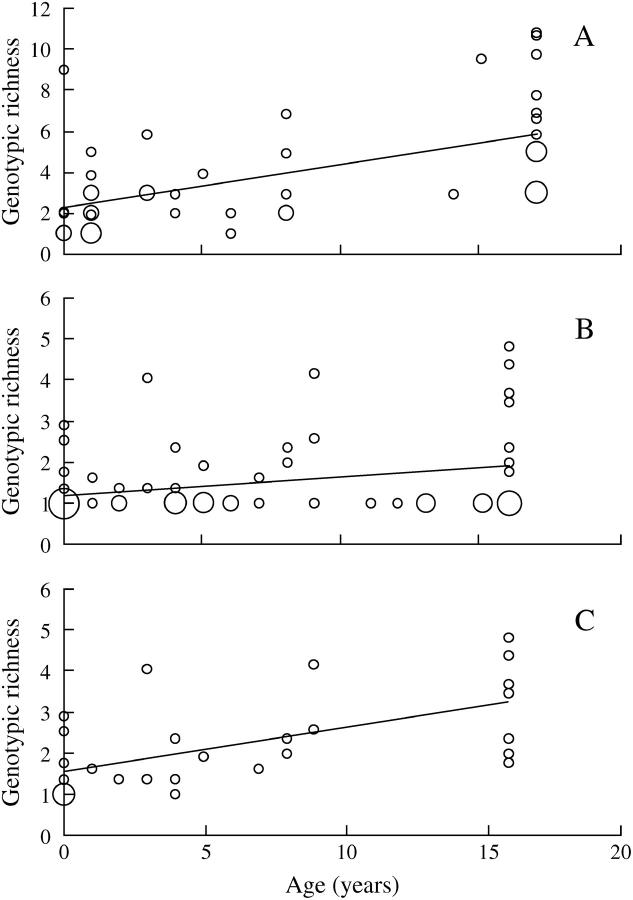
Figure 2.—
Relationship between genotypic richness and population age in D. longispina (A) and D. magna (B and C). B shows all D. magna populations and C shows only those populations that were not fixed for the most common genotype. The size of the dots indicates the number of populations with the same value.

