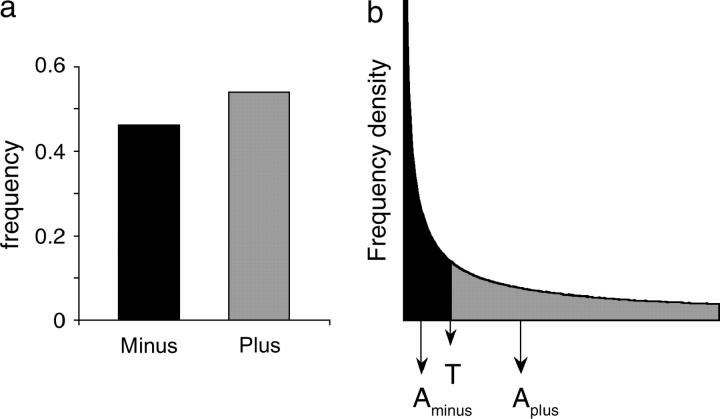
Figure 1.—
Assigning activity scores to categories based on a frequency distribution. (a) A hypothetical distribution of variants, with 47% in the “minus” class and the remainder in the “plus” class. (b) The fit of this classification to a known frequency distribution of effects on activity. For any given frequency distribution, there is a unique value T that divides the density into a minus class of 47% and a plus class with the remainder. Then, for this frequency distribution, variants in each class can be assigned a unique mean activity value (e.g., Aminus for variants in the minus category). This approach generalizes to any number of ranked categories.

