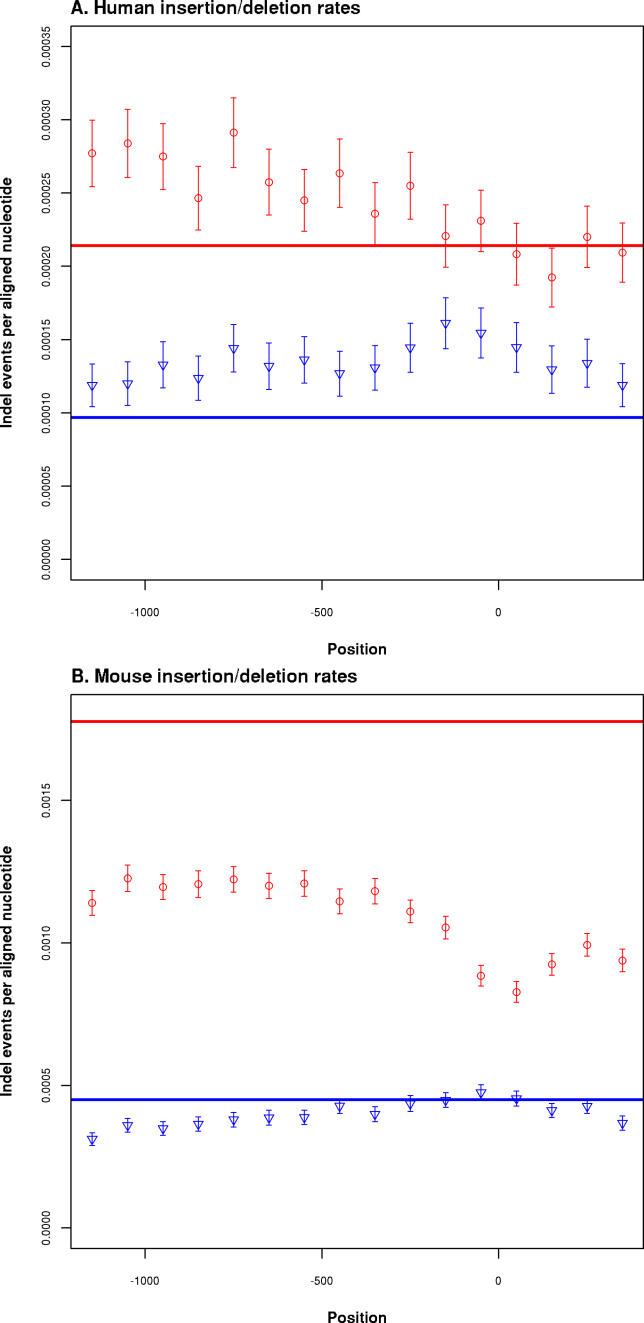
Figure 3. Micro-Insertion and -Deletion Rates.
Promoter rates calculated as insertion (blue) and deletion (red) events per nucleotide in 100-bp consecutive windows (x-axis). Error bars show 95% confidence intervals; solid horizontal lines show rates calculated from AR alignments. Vertical grey line indicates the +1 TSS position.
(A) Human rates based on alignments between human, chimpanzee, and macaque; rates shown are derived only from the human terminal branch (see Materials and Methods).
(B) Mouse terminal branch rates based on comparisons between mouse, rat, and dog.

