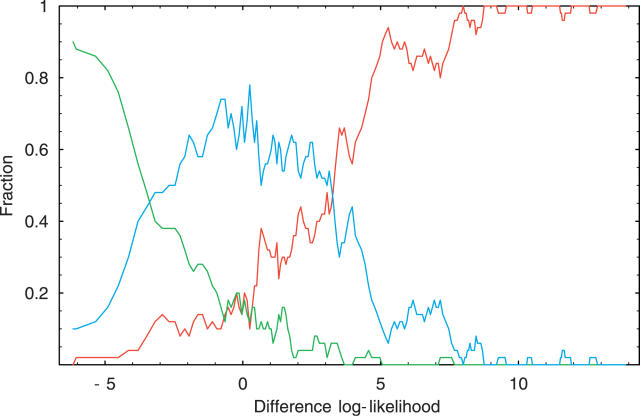
Figure 7. Dependency of the Frequency of Alternative Splicing at NAGNAG Sites on the Relative Likelihood of the Two Putative Acceptor Sites.
The figure shows the fraction of all NAGNAG boundaries that splice only at the first NAG (red), only at the second NAG (green), or at both NAGs (blue) as a function of the log-likelihood difference of the first and second putative splice sites for the acceptor site WM.

