
Figure 6. Heat Map Displaying Relative Expression Levels of Small-ORF Transcripts Present within 61 Mouse Tissues from the Genomics Institute of the Novartis Research Foundation GeneAtlas.
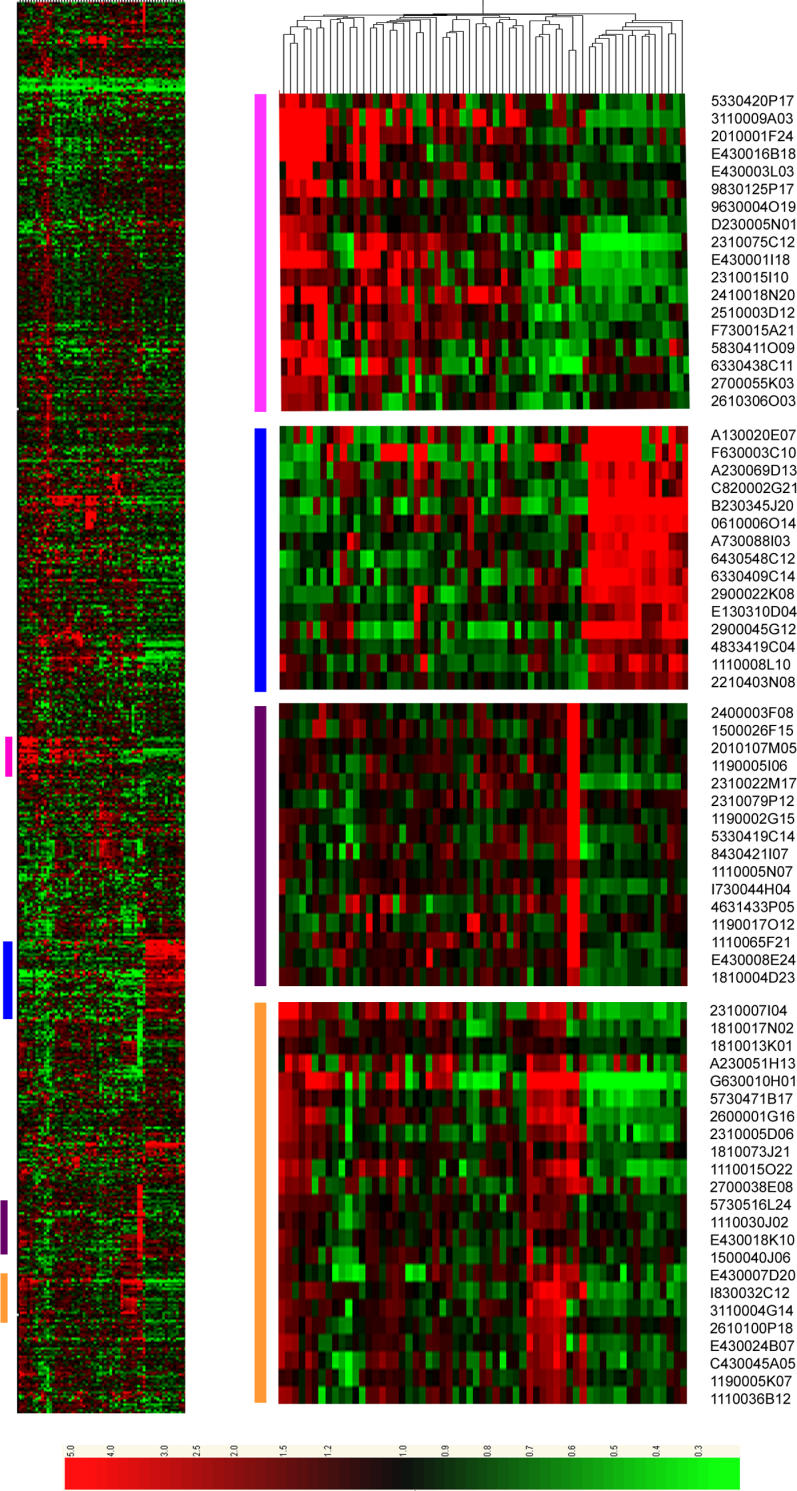
Small-ORF transcripts are clustered on the vertical axis, and tissue samples are along the horizontal axis. All gene expression is displayed relative to the median level of each transcript across all 61 tissues. The coloured columns on the left-hand side of the heat map (left) correspond to the blown up sections (right). FANTOM3 clone identifiers are included in the blown up clusters. A blow-up of the tissue clustering, including the tissue names, is available as Figure S1.