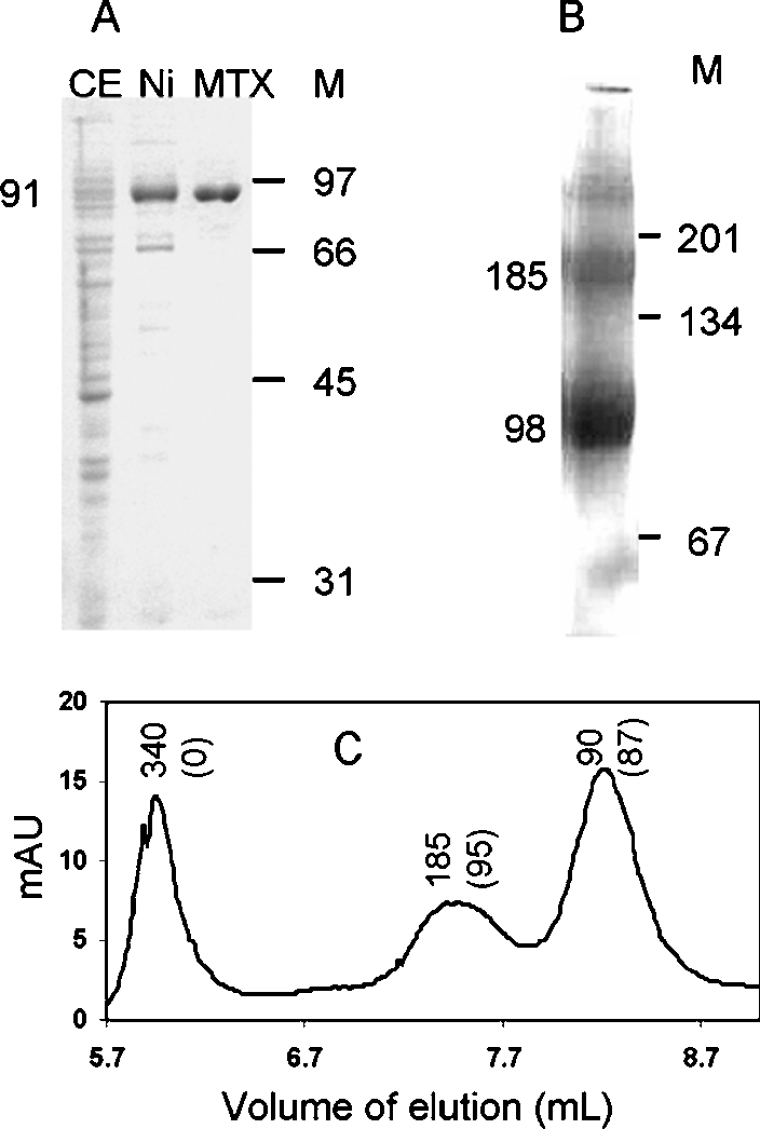
Figure 1. PAGE analysis and gel-filtration of recombinant AtADCS.
(A) SDS/PAGE analysis of the recombinant enzyme during the course of its purification. CE, crude extract; Ni, proteins eluted from the Ni-NTA-affinity column; MTX, proteins eluted from the MTX-affinity column; M, molecular-mass markers (sizes indicated in kDa). (B) Blue native PAGE analysis of the recombinant enzyme eluted from the MTX-affinity column. (C) Size-exclusion chromatography of the purified recombinant protein eluted from the MTX column. Numbers above the peaks indicate the estimated molecular mass (kDa) corresponding to the peak fractions, and numbers into brackets are the specific activities (nmol·min−1·mg−1 of protein) present in these fractions. mAU, milli-absorbance units.

