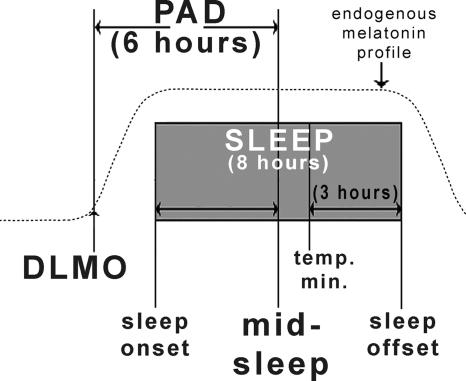
Fig. 1.
Schematic diagram of normal phase relationships (rounded to the nearest integer) between sleep phase markers, the 10 pg/ml plasma DLMO (10), and the core body temperature minimum (Tmin) (27, 32) derived from historical controls. The present study used the DLMO/midsleep interval PAD of 6 h as the hypothesized therapeutic window for optimal circadian alignment. Sleep times were determined actigraphically. Plasma melatonin levels were obtained under dim light every 30 min in the evening. The operational definition of the DLMO is the interpolated time of continuous rise above the threshold of 10 pg/ml; for example, if the melatonin level at 8 p.m. was 5 pg/ml and at 8:30 p.m. was 15 pg/ml, the DLMO would be 8:15 p.m.

