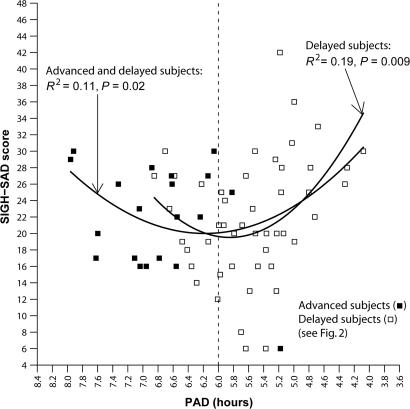
Fig. 3.
Posttreatment SIGH-SAD score as a function of PAD. The parabolic curve (minimum = 6.18) indicates that PAD accounts for 11% of the variance in SIGH-SAD scores [F (2, 65) = 3.96] for all subjects and 19% for phase-delayed subjects [F (2, 45) = 5.19]. Absolute deviations from the parabolic minima (6.18 and 5.85, respectively) were statistically significant (advanced and delayed subjects: r = 0.29, r2 = 0.09, df = 65, P = 0.02; delayed subjects: r = 0.48, r2 = 0.23, df = 65, P = 0.001).

