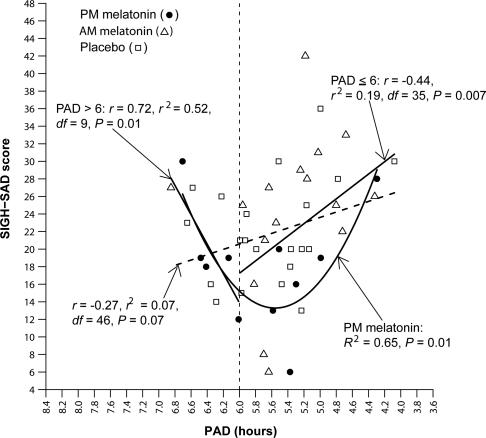
Fig. 4.
Posttreatment SIGH-SAD score as a function of PAD in delayed subjects. (The parabolic curve and related statistics for the delayed subjects are provided in Fig. 3.) The linear correlation between PAD and SIGH-SAD score (diagonal hatched line) did not reach statistical significance, confirming that the parabolic curve in Fig. 3 for delayed subjects (R2 = 0.19, P = 0.009) is the better fit for these data. Directional linear correlations for under- and overshifters (to the right and left of PAD 6, respectively) were both statistically significant. The parabolic curve for subjects receiving PM melatonin indicates that PAD accounts for 65% of the variance in SIGH-SAD scores [F (2, 8) = 7.57; minimum = 5.56]; the correlation between the absolute deviation from the parabolic minimum was also statistically significant (r = 0.75, r2 = 0.56, df = 8, P = 0.01).

