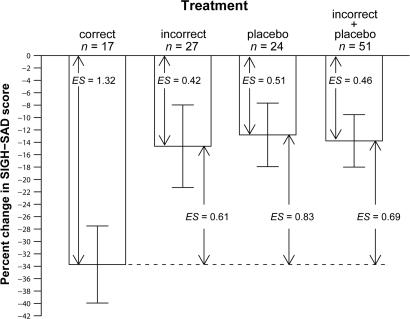
Fig. 6.
Percent change in (SIGH-SAD) depression score after correct treatment, incorrect treatment, and placebo, as well as incorrect treatment and placebo combined (see text for details of the composition of these treatment groups). Baseline SIGH-SAD scores for the three treatment groups (correct treatment, incorrect treatment, and placebo) were 28.9 ± 1.0, 28.8 ± 1.3, and 26.6 ± 1.4, respectively. The Kruskal–Wallis H test (χ2 = 5.83, df = 2, P = 0.05) was statistically significant, but not the one-way ANOVA [F = 2.96 on (2, 65), P = 0.06]. By using the Welch two-sample t test to compare differences in the change scores of the correct-treatment group with those of the other groups, correct treatment significantly decreased depression ratings more than the other groups: incorrect (19.1%: t = 2.09, df = 40.8, P = 0.04); placebo (20.9%: t = 2.60, df = 34.2, P = 0.01); the latter two groups combined (19.9%: t = 2.65, df = 32.1, P = 0.01). Pretreatment to posttreatment percent changes were significant for all groups: correct (t = 5.43, df = 16, P < 0.001), incorrect (t = 2.20, df = 26, P = 0.04), placebo (t = 2.50, df = 23, P = 0.02), and the latter two groups combined (t = 3.25, df = 50, P = 0.002). Effect sizes (ES) are shown for pretreatment to posttreatment percent change scores for each group; also shown are the more conservative ES for differences in change scores between the correct-treatment group and the other groups. [Before phase typing, percent change in the PM-treated group was −28.5 ± 5.6, and percent change in the AM-treated group was −15.5 ± 8.0, although there were no statistically significant differences between the three treatment groups in percent changes in SIGH-SAD scores (see above).]

