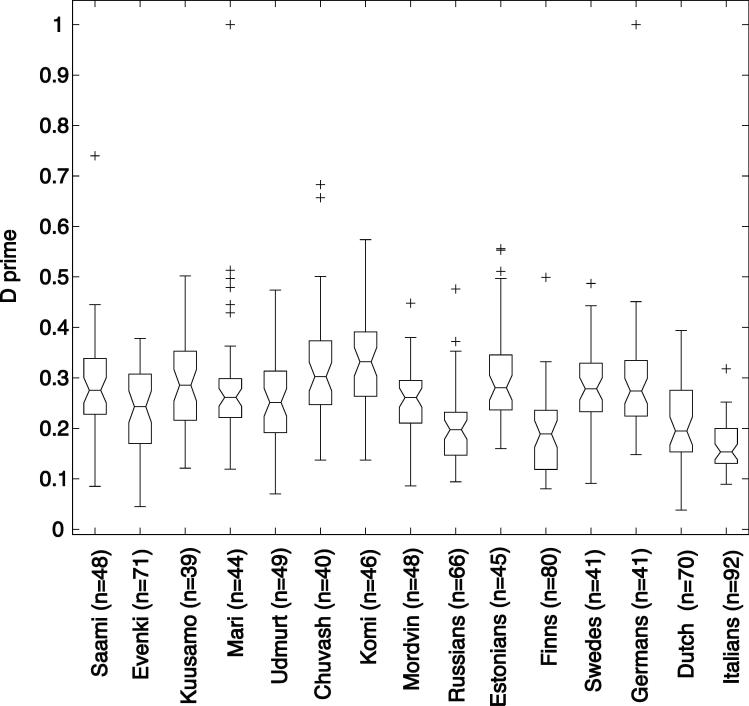
Figure 1.
Notched boxplot for the distribution of D' values between 48 unlinked locus pairs (D' BASE) formed between Xq13 and Xp22 microsatellite markers in studied populations. The boxes represent the 25th and 75th percentiles. The median D' is denoted as the line that bisects the boxes. Notches represent a robust estimate of the uncertainty about the medians for box to box comparison. The whiskers are lines extending from each end of the box covering the extent of the data on 15 X interquartile range. Crosses represent the outlier D' BASE values.

