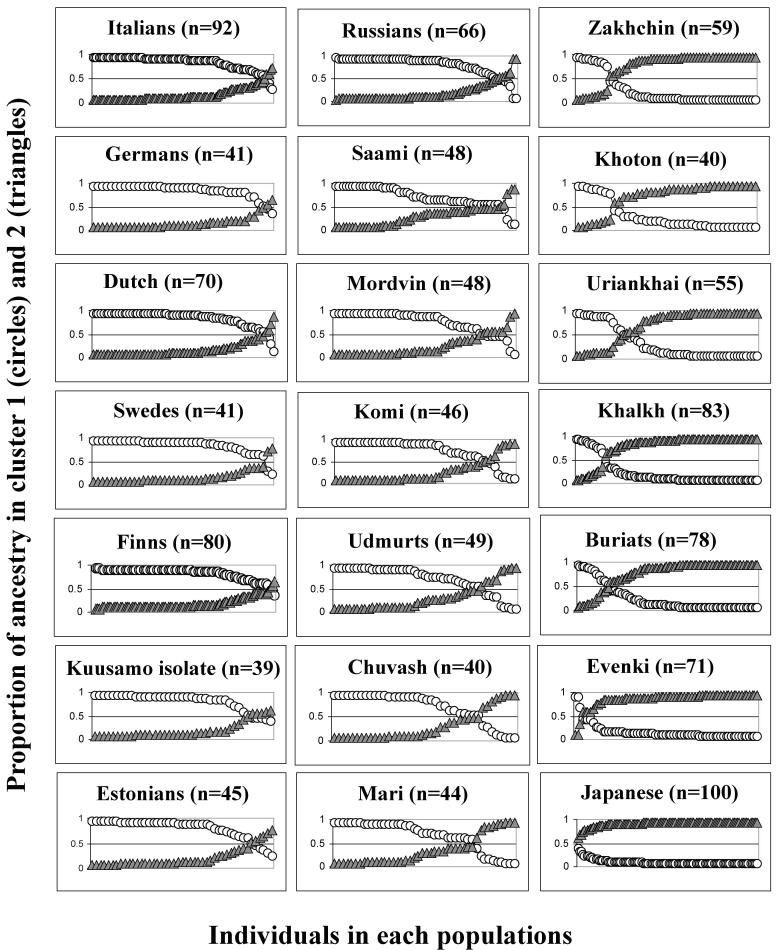
Figure 4.
Summary of the clustering results (K=2) for the data set A consisting of seven Xq13 microsatellite markers. In 21 studied populations, for each individual (x-axis of each graph) the mean value of the proportion of the ancestry in cluster 1 (white circles) and cluster 2 (gray triangles) was computed (y-axis of each graph). Based on the assignment of the majority of individuals of European origin into cluster 1 and of Asian origin into cluster 2, the two clusters are denoted in the text as “European” and “Asian”.

