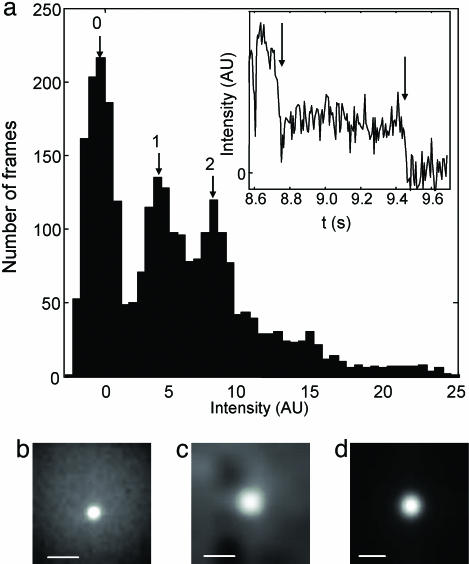
Fig. 3.
Trapping of individual fluorescent objects. (a) Histogram of intensities of individual trapped fluorescently labeled vesicles. The vesicles had an average diameter of 100 nm and were composed of egg-phosphatidylcholine with 1 part in 105 of the fluorescent lipid N-(6-tetramethylrhodaminethiocarbamoyl)-1,2-dihexadecanoyl-sn-glycero-3-phosphoethanolamine. A total of 26 vesicles were trapped, for a cumulative 2,690 video frames (at 6.5 ms per frame). Intensities were computed from a sliding average with a 26-ms window. Peaks indicate vesicles containing zero, one, or two fluorophores, as well as an unresolved contribution from more highly labeled vesicles. Some intensity values are negative because the background subtraction was set to yield zero mean intensity when the trap was empty. (Inset) A typical trajectory showing two-step photobleaching (arrows) of a vesicle containing two fluorophores. The vesicle was trapped with only one active fluorophore for ≈700 ms (between arrows). (b–d) Time-averaged images of trapped single molecules and CdSe nanocrystals. (b) A single molecule of B-phycoerythrin (average of 500 images taken over 2.2 s). (c) GroEL labeled with Cy3 (average of 10,000 images taken over 45 s). During this interval, several single molecules were sequentially trapped, eventually photobleached, and released from the trap. (d) A single CdSe fluorescent nanocrystal (average of 20,000 images taken over 90 s). (Scale bar in b–d, 2 μm.)

