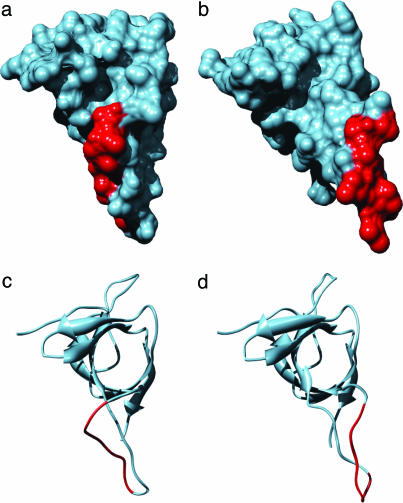
Fig. 2.
GroES binding motif GGIVLTGAA, residues 23–31 (red), in the unbound [molecular surface representation (a) and ribbons (c)] and bound (b and d) structures. The images in Figs. 2 and 5 were produced by using the chimera program (29) based on solvent-excluded molecular surfaces determined by using the msms package (30).

