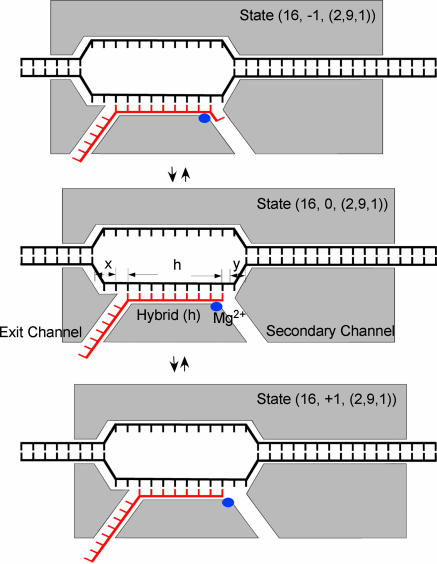
Fig. 1.
Model of the EC. Shown is a schematic representation of the EC, in a state labeled as (m, n, b) ≡ (m, n, (x, h, y)). The figure shows three translocational states, n = −1, n = 0, and n = +1, for a fixed transcript length of 16; at position 0 the 3′ end of RNA occupies the active center of the enzyme (the blue dot); x and y indicate, respectively, the number of unpaired DNA bases upstream (to the left) and downstream (to the right) of the hybrid of length h, and thus the size of the bubble is given by sb = x + h + y. In averaging over the bubble configurations, x, h, and y were varied between 2 and 5, 8 and 9, and 1 and 2, respectively, resulting in a variation of sb from 11 to 16.

