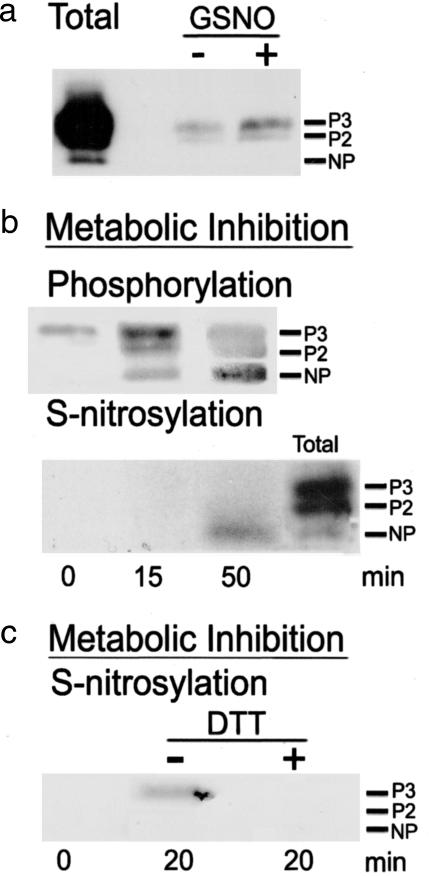
Fig. 5.
An NO donor and MI increase S-nitrosylation of surface Cx43. S-nitrosylation and phosphorylation states were determined by surface biotinylation and Western blot analysis as described in Supporting Text. (a) After 50 min of treatment with 100 μM GSNO, S-nitrosylation of P2 and P3 bands of surface Cx43 (GSNO/+, right lane) was increased over basal (GSNO/−, middle lane). The left lane (Total) shows Cx43 bands of phosphorylated forms in control homogenate (5 μg of protein). (b, upper gel) Reactive bands of surface Cx43 in astrocytes under control conditions (left lane) and after 15 min (middle lane) and 50 min (right lane) of MI. (b, lower gel) Bands of S-nitrosylated surface Cx43 in astrocytes under conditions identical to those in b (upper gel). Nitrosylation was detected at 50 min of MI but not at 0 or 15 min (left and middle lanes). The lane labeled Total is as in a. (c) MI for 20 min caused nitrosylation of surface Cx43 (−DTT, middle lane), whereas DTT (10 mM) for the last 5 min of 20 min of MI prevented or reversed nitrosylation (+DTT, right lane). No basal nitrosylation was detected (left lane). The electrophoretic mobilities of the NP and two phosphorylated (P2 and P3) forms of Cx43 are indicated.

