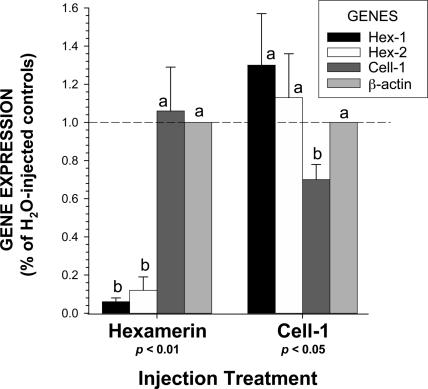
Fig. 3.
Effects of RNAi on gene expression at 24 h after siRNA injection in the Indiana MSH colony. The graph compares silencing effects on the genes Hex-1, Hex-2, and Cell-1, as well as the control gene, β-actin, between hexamerin and Cell-1 RNAi treatments. Results are expressed as the percentage of gene expression relative to water-injected controls. Means labeled with the same letter (a or b) within each treatment are not significantly different by the Kruskal–Wallis test (n = 5; df = 1; P < 0.01 or P < 0.05). (Error bars represent SEM.)

