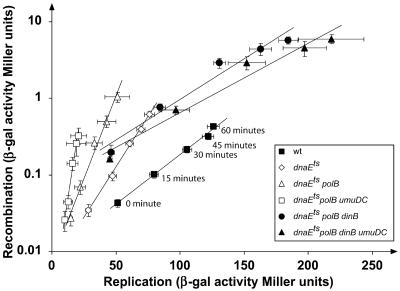
Fig. 5.
Relationship between replication and recombination. The data used for this analysis are measurements of replication and recombination efficiencies during the 1st hour after mating interruption. Each point represents the mean (±SE) of values from at least four independent experiments. Slope of the correlation between the replication and the recombination and coefficient of determination (R2) are, for WT, 0.029 and 0.99; for dnaEts, 0.061 and 0.99; for dnaEts polB, 0.1 and 0.99; for dnaEts polB umuDC, 0.25 and 0.98; for dnaEts polB dinB, 0.024 and 0.96; and, for dnaEts polB dinB umuDC, 0.021 and 0.96.

