Abstract
Aquaporin-5 (AQP5) is expressed in epithelia of lung, cornea, and various secretory glands, sites where extracellular osmolality is known to fluctuate. Hypertonic aquaporin (AQP) induction has been described, but little is known about the effects of a hypotonic environment on AQP abundance. We report that, when mouse lung epithelial cells were exposed to hypotonic medium, a dose-responsive decrease in AQP5 abundance was observed. Hypotonic reduction of AQP5 was blocked by ruthenium red, methanandamide, and miconazole, agents that inhibit the cation channel transient receptor potential vanilloid (TRPV) 4 present in lung epithelial cells. Several observations indicate that TRPV4 participates in hypotonic reduction of AQP5, including a requirement for extracellular calcium to achieve AQP5 reduction; an increase in intracellular calcium in mouse lung epithelial (MLE) cells after hypotonic stimulation; and reduction of AQP5 abundance after addition of the TRPV4 agonist 4α-Phorbol-12,13-didecanoate (4α-PDD). Similarly, addition of hypotonic PBS to mouse trachea in vivo decreased AQP5 within 1 h, an effect blocked by ruthenium red. To confirm a functional interaction, AQP5 was expressed in control or TRPV4-expressing human embryonic kidney (HEK) cells. Hypotonic reduction of AQP5 was observed only in the presence of TRPV4 and was blocked by ruthenium red. Combined with earlier studies, these observations indicate that AQP5 abundance is tightly regulated along a range of osmolalities and that AQP5 reduction by extracellular hypotonicity can be mediated by TRPV4. These findings have direct relevance to regulation of membrane water permeability and water homeostasis in epithelia of the lung and other organs.
Keywords: epithelium, lung, membrane permeability, osmotic stress, calcium channel
Aquaporin water channel proteins participate in a wide array of physiological processes and are the primary determinants of membrane osmotic water permeability (1). Aquaporin (AQP)-5 is on the apical membrane at several sites in mammals, including secretory cells in salivary, lacrimal, sweat, and airway submucosal glands, corneal epithelium, nasopharyngeal and bronchial epithelium, and type I pneumocytes of the lung (2–5). Studies of isolated salivary gland epithelial cells (6) and type I pneumocytes (7) demonstrate that AQP5 confers high level membrane water permeability to the cell and that cellular responses to an initial osmotic challenge as well as subsequent regulatory volume changes require AQP5 (6).
AQP5 abundance is regulated by numerous stimuli, including TNF-α (8), adenoviral infection (9), cAMP (10, 11), and hypertonic stress (12, 13). The general paradigm of aquaporin induction by extracellular hypertonicity is well established because, in addition to AQP5, hypertonic induction of AQP1 (14–16), AQP3 (13, 17, 18), AQP4 (19, 20), and AQP9 (20) has been reported. In contrast, the effects of reduced extracellular osmolality on aquaporin abundance have not been reported.
Transient receptor potential-vanilloid (TRPV) 4 is a nonselective cation channel expressed in a variety of tissues, including respiratory epithelium, salivary glands, and sweat glands (21–27), sites where AQP5 is expressed. The subcellular distribution of TRPV4 has not been described. TRPV4 can be activated by extracellular hypotonicity and products of the P450 epoxygenase pathway of arachidonic acid metabolism (24, 28, 29). Like several members of the TRPV family, TRPV4 is activated by warm temperature, with a threshold between 28°C and 34°C (24). TRPV4 activation by temperature change is modulated by extracellular osmolality, and hypotonic activation is modulated by temperature. Few specific downstream effects of TRPV4 activation have been described, but TRPV4 participates in thermosensation, mechanosensation, and osmoregulation (28).
Reports of the osmolality of the surface layer above the lung epithelium in unstressed conditions vary from hypotonic to hypertonic, and osmolality varies with increased ventilation or pathologic states (30–32). In these studies, we examined the effects of extracellular hypotonicity on regulation of AQP5 in lung epithelial cells. We found that, in contrast to the induction of AQP5 by hypertonic stress (12, 13), AQP5 abundance is reduced in a stepwise fashion by reductions in extracellular osmolality. Hypotonic reduction of AQP5 was augmented and reduced, respectively, by conditions that activate or inhibit TRPV4, and the response to hypotonicity was recapitulated when TRPV4 and AQP5 were coexpressed in human embryonic kidney (HEK) cells. Coupled with earlier studies, these findings indicate that AQP5 abundance is tightly controlled along a spectrum of extracellular osmolalities and that its abundance in hypotonic conditions can be regulated by TRPV4 activation.
Results
Extracellular Hypotonicity Decreases AQP5 Abundance.
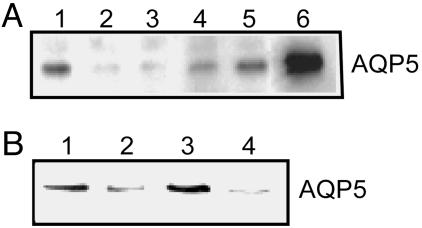
Mouse lung epithelial (MLE)-12 cells exhibit polarized apical expression of AQP5 (11), similar to the predominant in vivo pattern. As described (11–13), addition of hypertonic medium markedly increased its abundance (Fig. 1A). In contrast, within 2 h, hypotonic medium [127 milliosmolar (mosM)] markedly reduced AQP5 abundance. Normal medium diluted by one-half with water and brought to isotonic with sorbitol had no effect on AQP5 abundance, indicating that the decrease in medium osmolality, not a change in concentration of medium components, reduced AQP5 (data not shown). Hypotonic reduction of AQP5 was evident by 30 min (exposure time for subsequent studies) but was not observed earlier than 10 min (data not shown). When cells were incubated in hypotonic medium for 12 h, followed by addition of higher tonicity medium (to a total of 200 mosM, Fig. 1A, lane 4; to 276 mosM, lane 5) for 14 h, AQP5 increased in stepwise fashion back to the levels of abundance observed in isotonic medium. The increase in AQP5 abundance after switching from hypotonic to isotonic medium was blocked by inhibition of EGF receptor (EGFR) activation (Fig. 1B), consistent with our observation of EGFR family-dependent hypertonic induction of AQP5 (13).
Fig. 1.
Hypotonicity reduces AQP5 abundance in lung epithelial cells. (A) MLE-12 cells were incubated in isotonic (276 mosM), hypotonic, or hypertonic medium (as indicated) for the designated times, and protein immunoblots of cell lysates were probed for AQP5. Lanes are as follows: 1, 276 mosM; 2, 127 mosM, 2 h; 3, 127 mosM, 12 h; 4, 127 mosM, 12 h, then 200 mosM, 14 h; 5, 127 mosM, 12 h, then 276 mosM, 14 h; 6, 480 mosM, 24 h. (B) Cells were grown under conditions as noted, and lysates were probed for AQP5. Lanes are as follows: 1, 276 mosM; 2, 127 mosM, 0.5 h; 3, 127 mosM, 0.5 h, then 276 mosM, 8 h; 4, 127 mosM, 0.5 h, then 276 mosM, 8 h plus AG1478 (10 μM).
As assessed by quantitative RT-PCR, AQP5 mRNA was not reduced by hypotonicity (data not shown), indicating that the reduction in protein abundance did not result from decreased transcriptional activity. We previously demonstrated AQP5 degradation in lysosomes rather than proteosomes in MLE-12 cells (11). To confirm lysosomal degradation of AQP5 in hypotonic conditions, we added the lysosomal inhibitor chloroquine to control and hypotonic cells and assessed AQP5 abundance. AQP5 abundance increased in the presence of chloroquine in isotonic conditions as described (11); however, cells died rapidly when chloroquine was added in hypotonic conditions.
Pharmacologic Studies Indicate that TRPV4 May Mediate the Hypotonic Reduction in AQP5.
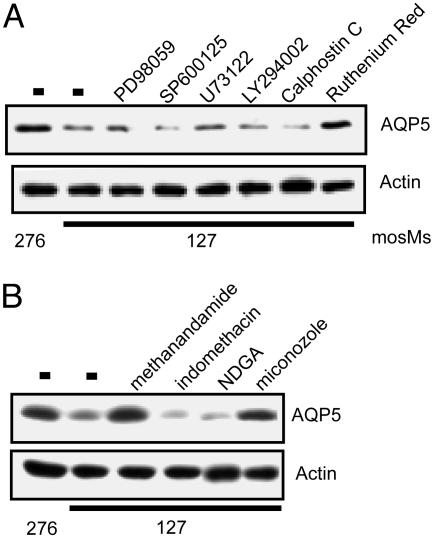
We examined the effects of inhibiting pathways implicated in hypotonic responses (33), including the extracellular signal-regulated kinase (ERK), jun N-terminal kinase (JNK), phospholipase C (PLC), phosphoinositide 3-kinase (PI3-kinase), and PKC; however, these agents had no effect on the hypotonic reduction of AQP5 (Fig. 2A). Extracellular nucleotides participate in cystic fibrosis transmembrane conductance regulator (CFTR) activation in response to hypotonic stress (34, 35). Neither adenosine nor ATP altered AQP5 abundance (data not shown). In contrast, ruthenium red (RR), an inhibitor of multiple TRPV channels (36), completely blocked the reduction of AQP5 in response to hypotonic stress. A downstream product of the P450 pathway of arachidonic acid metabolism, (5,6)-epoxy eicosatrienoic acid (EET), directly activates TRPV4 (37), and TRPV4 activation can be blocked by selective inhibitors of the eicosanoid pathway (37). Treatment of MLE cells with the cyclooxygenase inhibitor indomethacin or the lipoxygenase inhibitor nordihydroguaiaretic acid (NDGA) had no effect on the hypotonic reduction of AQP5 (Fig. 2B). In contrast, methanandamide, which blocks the conversion of anandamide to arachidonic acid, and miconazole, which blocks the generation of EET, completely blocked hypotonic reduction of AQP5.
Fig. 2.
RR blocks the hypotonic reduction in AQP5. (A) MLE-12 cells were incubated (designated osmolality, 2 h) in the presence or absence of inhibitors of signaling pathways implicated in hypotonic responses: the extracellular signal-regulated kinase inhibitor PD98059 (10 μM), the jun N-terminal kinase inhibitor SP600125 (30 μM), the phospholipase C inhibitor U73122 (5 μM), the phosphoinositide 3-kinase inhibitor LY29002 (10 μm), the PKC inhibitor calphostin C (5 μM), and the TRPV4 inhibitor RR (20 μM). (B) Cells were incubated in isotonic or hypotonic medium as noted, in the presence or absence of the designated agents: methanandamide (10 μM), a competitive inhibitor of anandamide; the cyclooxygenase inhibitor indomethacin (20 μM); the lipoxygenase inhibitor nordihydroguaiaretic acid (NDGA) (50 μM); and an eicosatrienoic acid inhibitor, miconazole (10 μM). The NDGA and miconozole samples were spliced to eliminate irrelevant intervening lanes. Protein immunoblots were probed for AQP5 or actin (loading control).
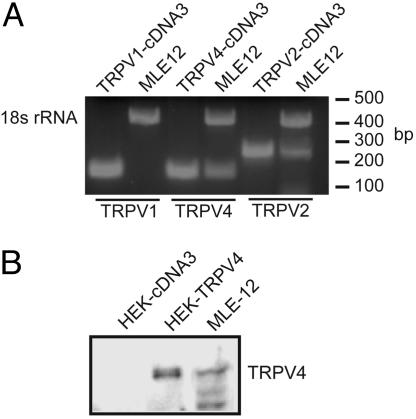
TRPV1, TRPV2, and TRPV4 are reported to be in lung, have been implicated in osmotransduction, and can be inhibited by RR. By using specific primers, RT-PCR revealed a strong band for TRPV4 mRNA (Fig. 3A), and immunoblots of cell lysates revealed the presence of TRPV4 protein (Fig. 3B). TRPV1 was not detected by RT-PCR, but a band for TRPV2 was evident.
Fig. 3.
MLE-12 cells express TRPV4. (A) Total RNA was harvested from MLE-12 cells, and RT-PCR was performed by using primers specific to 18S ribosomal RNA (18S control), TRPV1, TRPV2, or TRPV4, and products were visualized on an agarose gel. (B) Cell lysates from HEK control, TRPV-expressing cells, or MLE-12 cells were probed for TRPV4.
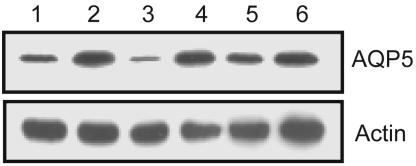
We tested whether hypotonic reduction of AQP5 also occurred from a hypertonic starting point. Incubation of MLE cells in hypertonic medium for 12 h increased the abundance of AQP5 (Fig. 4, lane 2). When cells were shifted from hypertonic medium (476 mosM) to hypotonic medium (127 mosM), AQP5 abundance was markedly reduced by 30 min (Fig. 4 lane 3), an effect inhibited by RR (Fig. 4, lane 4). Similarly, when cells were returned from hypertonic medium to isotonic medium (Fig. 4, lane 5), AQP5 was reduced to near isotonic levels. This reduction was also blocked by RR (Fig. 4, lane 6).
Fig. 4.
RR blocks AQP5 reduction in response with absolute or relative hypotonicity. MLE cells were incubated in medium for 30 min in the presence or absence of RR, and cell lysates were probed for actin and AQP5. Lanes are as follows: 1, 276 mosM; 2, 476 mosM, 8 h; 3, 476 mosM, 8 h, then 127 mosM, 0.5 h; 4, 476 mosM, 8 h, then 127 mosM, 0.5 h plus RR (20 μM); 5, 476 mosM, 8 h, then 276 mosM, 0.5 h; 6, 476 mosM, 8 h, then 276 mosM, 0.5 h plus RR (20 μM).
Hypotonic Reduction in AQP5 in Mouse Trachea.
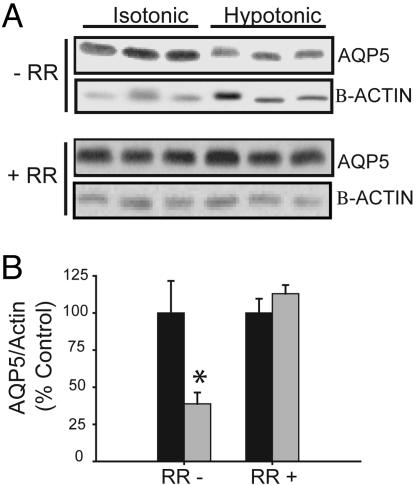
Both TRPV4 and AQP5 are present in proximal airway epithelial cells (38, 39). To examine the effects of hypotonicity in vivo, mice were ventilated through a low extrathoracic tracheostomy, and the proximal trachea was exposed to isotonic (300 mosM) or hypotonic (150 mosM) PBS, followed by harvest of the trachea. Administration of hypotonic PBS prewarmed to 32°C (but not 25°C; data not shown) for 1 h led to a significant decrease in AQP5 abundance compared with isotonic PBS (Fig. 5A). In trachea pretreated with RR (10 μM) for 10 min, AQP5 was not reduced by hypotonic PBS (Fig. 5B), consistent with our in vitro observations.
Fig. 5.
Hypotonicity leads to a reduction in AQP5 expression in mouse trachea. (A) PBS (300 mosM) or PBS diluted to 150 mosM with water (solutions prewarmed to 32°C) was instilled into proximal trachea for 1 h in the absence (−) or presence (+) of RR (pretreatment 10 min). Immunoblots of membrane samples from trachea were probed for AQP5 and β-actin. (B) Immunoblots from A were scanned by using densitometry, and AQP5 abundance was normalized to actin and expressed as a percentage of the control value. ∗, P < 0.05.
Calcium and the Hypotonic Reduction of AQP5.
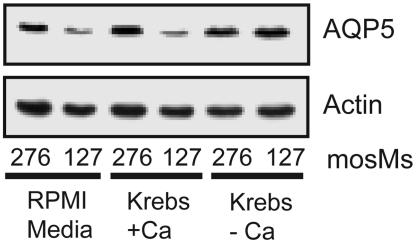
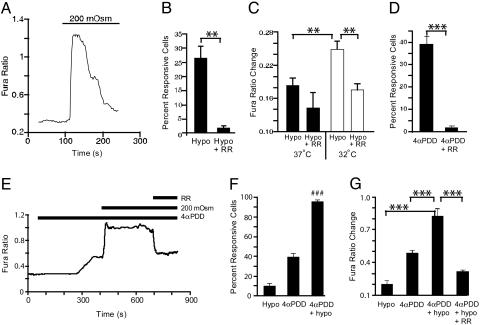
TRPV4 mediates influx of extracellular calcium (40, 41). We therefore grew MLE-12 cells in normal medium, or a Krebs medium with or without calcium. When normal medium or calcium-containing Krebs medium was diluted to generate hypotonic medium, AQP5 reduction by hypotonic stress was observed (Fig. 6). In contrast, AQP5 was not reduced after exposure to calcium-free Krebs diluted to 127 mosM, indicating a requirement for extracellular Ca2+. Addition of the Ca2+ ionophore A23187 did not reduce AQP5 abundance, suggesting that simply increasing intracellular Ca2+ is not sufficient to elicit the response (data not shown). To confirm that hypotonic stress increased intracellular calcium, fura-2-loaded MLE-12 cells were exposed to isotonic or hypotonic medium, and ratiometric images were obtained by fluorescence microscopy. In response to hypotonic stress, intracellular Ca2+ was increased beyond the defined threshold (0.1 ratio units) in 25% of cells within ≈2.5 min, a response that partially desensitized with time and was reduced by RR (Fig. 7A and B). The magnitude of the change in intracellular Ca2+ (measured at ≈25°C) was greater after overnight incubation at 32°C than after overnight incubation at 37°C (23) (Fig. 7C). Subsequent calcium imaging experiments were performed after 32°C incubation. 4α-Phorbol-12,13-didecanoate (4α-PDD) (10 μM), a selective activator of TRPV4 (36), increased intracellular Ca2+ in a significantly greater number of cells and was inhibited by RR (Fig. 7D). Combination of hypotonicity and 4α-PDD resulted in an increase in the mean amplitude of the Ca2+ response and a supraadditive increase in the percentage of responding cells, compared with either stimulation alone (Fig. 7 E–G), a pattern suggestive of synergistic action at a single site. This Ca2+ response was also RR-sensitive (Fig. 7 E and G) and could be reversed by removal of extracellular Ca2+ (82.3 ± 3.4% decrease; see supporting information, which is published on the PNAS web site), demonstrating a dependence on Ca2+ influx, and consistent with mediation by TRPV4.
Fig. 6.
Hypotonic reduction of AQP5 requires extracellular calcium. Lung epithelial cells were grown in normal medium or in Krebs buffer with or without calcium for 30 min (designated osmolalities). Immunoblots of cell lysates were probed for actin or AQP5.
Fig. 7.
Hypotonicity and 4α-PDD increase intracellular Ca2+ in MLE-12 cells. (A) Change in relative intracellular Ca2+, indicated by a change in the fura-2 fluorescence ratio, in a representative MLE-12 cell (incubated overnight at 37°C, then assayed at ≈25°C) during a switch from isotonic (300 mosM) to hypotonic (200 mosM) buffer. (B) Percentage of cells exhibiting a hypotonic-evoked change in fura ratio >0.1 ratio units in the experiment shown in A under control conditions (Hypo), or when ruthenium red (10 μM) was administered 2 min before hypotonic stimulation (Hypo + RR). (C) Amplitude of hypotonic-evoked fura ratio change (among hypotonic-responsive cells) in cells incubated overnight at 32°C versus 37°C. (D) Percentage of cells (incubated overnight at 32°C) responsive to 4α-PDD (10 μM) and inhibition by RR. (E) Representative trace of fura ratio in cells subjected to successive exposure to 200 mosM, 4α-PDD, and RR. (F and G) Percentage of responsive cells (F) and mean fura ratio change (G) after stimulation with hypotonic solution alone versus 4α-PDD alone or a combination of the two. Hypotonic responses were recorded in one set of coverslips, whereas responses to 4α-PDD, 4α-PDD plus hypotonic, and inhibition by ruthenium red were recorded from another set of coverslips treated as in E. Data shown represent mean ± SEM, n = 6. ∗∗, P < 0.01, ∗∗∗, P < 0.001, unpaired (B–D) or paired (G) Student’s t test. (F) ###, P < 0.001 versus sum of individual hypotonic and 4α-PDD responses, unpaired Student’s t test.
TRPV4 Agonist Potentiates Hypotonic Reduction of AQP5.
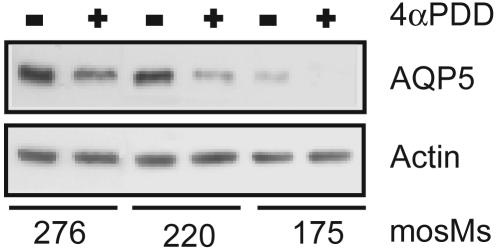
Addition of the TRPV4-specific agonist 4α-PDD to MLE-12 cells at 37°C in isotonic medium had no effect on AQP5 abundance, whereas addition to hypotonic medium slightly reduced AQP5 abundance (data not shown). In cells incubated at 32°C, exposure to 4α-PDD reduced AQP5 abundance even in isotonic medium and augmented the marked stepwise decrease in AQP5 abundance seen with reduced medium osmolality (Fig. 8).
Fig. 8.
The TRPV4 agonist 4α-PDD potentiates the hypotonic reduction of AQP5. Cells were incubated in medium of the designated osmolalities for 30 min at 32°C in the presence or absence of 4α-PDD. Immunoblots of cell lysates were probed for AQP5 and actin.
Recombinant TRPV4 Mediates AQP5 Reduction by Hypotonicity.
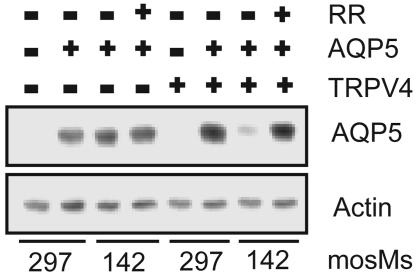
To confirm a functional relationship between TRPV4 and the hypotonic reduction of AQP5, we tested HEK cells stably transfected with TRPV4. No AQP5 was detected in HEK cells stably transfected with control-plasmid or with TRPV4 (23) (Fig. 9). When AQP5 was transfected into control HEK cells lacking TRPV4, no hypotonic reduction of AQP5 protein abundance was noted. When AQP5 was transfected into TRPV4-expressing HEK cells, a marked reduction in AQP5 abundance was observed after incubation of cells in hypotonic medium for 30 min, an effect blocked by RR. These findings indicate that TRPV4 participates in modulation of AQP5 abundance by hypotonic stress.
Fig. 9.
TRPV4 is required for the hypotonic reduction in AQP5 abundance. HEK control or TRPV4-expressing cells were transiently transfected with a control plasmid or AQP5. Thirty-six hours after transfection, cells were incubated in medium of the designated osmolality for 30 min in the presence or absence of RR, and immunoblots of cell lysates were probed for AQP5.
Discussion
A fundamental requirement for preservation of normal cell function is the ability to sense and respond to changes in the extracellular environment. In addition to the kidney, this is particularly true at epithelial surfaces where an interface with the outside environment exists, such as the epithelium of the respiratory tract. The absolute osmolality of the airway surface liquid (ASL) has proven difficult to determine. Recent reports in mouse (42, 43) and rat (44) airways indicate that ASL osmolality is hypotonic in basal conditions, whereas others suggest it is isotonic (32, 45). More certainly, when ventilation is increased, for example with exercise, the ASL osmolality increases (31, 32, 46), with return to basal levels with cessation. Therefore, the airway epithelium is exposed to an ASL in which the osmolality may vary depending on factors such as airflow or temperature, as well as in response to other host or environmental factors. We have shown that AQP5 abundance is dynamically regulated across a range of osmolalities and that distinct mechanisms underlie the hypertonic and hypotonic responses.
Aquaporins provide a low resistance path for water to cross the cell membrane and are the primary determinant of membrane osmotic water permeability. When cells are exposed to a hypotonic extracellular environment, they swell over a short period, followed by a slower shrinkage back toward their baseline size, a process known as regulatory volume decrease (47). Studies of mammalian cells, including mouse salivary gland and corneal epithelial cells, revealed that, in addition to determining the initial rate of swelling, the absence of AQP5 also reduced the rate of regulatory volume decrease (6, 48). Given the potential consequences of disrupted cell volume regulation on cell signaling, barrier function, and viability, the mechanisms regulating cellular responses to anisosmotic stress must be tightly controlled. Unrestricted cell swelling can lead to rupture, and changes in intracellular osmolality can limit enzyme function.
We examined the potential role of TRPV4 in the hypotonic reduction of AQP5 because it is present in lung epithelium (39), is activated by hypotonic stress (28), participates in regulation of cell volume (49), and is activated within the temperature range relevant to lung epithelium (23, 50). In addition to cell volume regulation, TRPV4 has been implicated in regulation of ciliary function (51) and is proposed to play a role in airway smooth muscle contraction (52). Our studies suggest that TRPV4 activation by hypotonicity leads to a reduction in AQP5 abundance. Ca2+ influx seems to be a necessary, but not sufficient, contributor to this effect. However, we cannot exclude the possibility that other RR-sensitive channels also contribute to AQP5 down-regulation in MLE-12 cells. For example, we detected expression of a transcript for TRPV2 in these cells. It remains undefined whether TRPV2 is active within the relevant temperature range, or whether arachidonic acid metabolites implicated in our studies can activate TRPV2. A definitive resolution of this matter will require the use of subtype-selective antagonists, which are not yet available, or knockdown/knockout strategies aimed at these channels. The supraadditive effects of 4α-PDD, which fails to activate TRPV2, strongly suggests that TRPV4 is at least contributory to this process. Further support for this notion comes from our observation that heterologous reconstitution of TRPV4 and AQP5 together (but not individually) into HEK cells recapitulated the hypotonic reduction of AQP5 observed in lung epithelial cells. It is notable that RR blocked AQP5 reduction whenever extracellular osmolality decreased, and EGFR inhibition blocked hypertonic AQP5 induction regardless of the starting osmolality, implicating these mechanisms in shifts across a broad range of osmolalities. It remains unclear whether there is cross-talk between EGFR-mediated induction, and TRPV4-mediated reduction, of AQP5 abundance. Likewise, the mechanism(s) linking TRPV4 activation and AQP5 remain undefined at present. We have previously shown that AQP5 is degraded in lysosomes within minutes of treatment with cAMP (11). In these studies, inhibition of lysosomes in a hypotonic (but not isotonic) environment led to rapid cell death, limiting our ability to confirm the contribution of lysosomal degradation. Although it is possible that AQP5 is shed to the extracellular space, or degraded by nonlysosomal pathways, we anticipate that internalization to a late endosomal compartment is fundamental to hypotonic down-regulation. It is curious that chloroquine toxicity was markedly increased in cells exposed to hypotonic medium, and it remains possible that the impaired ability of the cell to regulate AQP5 abundance in hypotonic conditions contributed to cell death.
Of interest, both the calcium flux and the decrease in AQP5 were more pronounced when studies were performed in cells preincubated at 32°C rather than at 37°C. The temperature at the airway surface in the upper respiratory tract has not been described, but the surface temperature in the nasopharynx or upper airways may be somewhat less than 37°C, particularly when breathing at increased rates of flow, for example with exercise, or when the temperature of the inspired air is reduced. The molecular mechanisms underlying hydration of the inspired airstream are as yet not known, but modulation of apical membrane aquaporin expression in response to changes in airflow or air temperature is a plausible contributor. Changes in airway temperature and surface osmolality have been suggested to be etiologic factors in the pathogenesis of exercise- or cold-induced asthma (53). Although many pathways may be involved in these conditions, the interaction between temperature and osmolality in regulating TRPV4 activation and AQP5 abundance may prove relevant to their pathogenesis.
We believe that dynamic regulation of AQP5 abundance by changes in extracellular osmolality is highly relevant to airway biology. Our investigation suggests distinct mechanisms for this regulation, with TRPV4 activation mediating hypotonic reduction, and EGFR activation mediating hypertonic induction. These findings, coupled with observations indicating that the presence of AQP5 is fundamental to ASL secretion (54) and cell volume regulation (6), suggest important potential roles for this pathway in airway surface regulation, and may extend to regulation of water homeostasis at other sites where these proteins are present, including salivary and sweat glands.
Materials and Methods
Materials.
Electrophoresis reagents were from Bio-Rad. Reagents for enhanced chemiluminescence (ECL+) were from Amersham Pharmacia. Bicinchoninic acid (BCA) protein assay kit was from Pierce. Antibodies to the carboxyl terminus of mouse (38) and human (55) AQP5 were generated by our laboratory. Antibodies to actin were from Upstate Biotechnology (Lake Placid, NY). Horseradish peroxidase-coupled secondary antibodies to rabbit or mouse immunoglobulins were from Amersham Pharmacia. RR was purchased from Sigma. Unless specified, all other reagents were from Sigma.
Cell Culture.
MLE-12 cells (a gift from J. Whitsett, University of Cincinnati, Cincinnati) (56), were grown on untreated culture dishes (Falcon/Becton Dickinson) as described (13). HEK cells stably expressing rat TRPV4 (pCDNA-TRPV4) and HEK-pCDNA control cells were grown on untreated culture dishes (Falcon/Becton Dickinson), as described (23). When noted, medium was made hypotonic by dilution with water, and osmolality was measured by vapor pressure reduction (5100C Vapor Pressure Osmometer; Wescor, Logan, UT). Standard Krebs media (see supporting information) or calcium-free Krebs (supplemented with 1 mM EGTA) were used for select experiments. Cell harvest was performed as described (12). All experiments were repeated two to three times.
Transfection.
Control and TRPV4-expressing HEK cells (23) were grown in six-well dishes to 50–60% confluence and transiently transfected (1 μg per well) with a hemagglutinin (HA)-tagged human AQP5 cDNA by using FuGENE 6 (Roche, Indianapolis, IN). Human AQP5 was inserted into the EcoRI site in the carboxyl-terminal multicloning site of the EGFP-C3 plasmid (BD Biosciences Clontech). The N-terminal GFP was replaced by HA by using HindIII and AgeI restriction sites.
Sample Processing and Immunoblotting.
After treatment, cells were harvested by scraping and lysed in RIPA buffer (50 mM Tris, pH 7.5/0.1% SDS/0.5% sodium deoxycholate/1% Nonidet P-40/150 mM NaCl/complete protease inhibitor mixture tablet). Total protein concentration was determined by the bicinchoninic acid assay. Equal amounts of total protein (10–50 μg, depending on experiment) in 1.5% (wt/vol) SDS were loaded per lane of 12% SDS/PAGE gels, transferred to nitrocellulose, and probed as described (57). Equivalence was confirmed by probing for actin or Ponceau Red staining (Bio-Rad) of nitrocellulose membranes.
PCR.
RNA was purified from MLE-12 cells by using RNeasy purification kit (Qiagen, Valencia, CA). Residual DNA was digested by using on-column RNase-free DNase (Qiagen). RT-PCR with primers specific for TRPV1, TRPV2, TRPV4, and 18S rRNA was performed (see supporting information). Real-time quantitative PCRs (RT-qPCRs) to assess AQP5 mRNA were performed to determine mRNA abundance, which was calculated as the fold change in the cycle threshold (ΔCT) by using the 2-ddCT method (58), and normalized to the ΔCT values for 18S ribosomal mRNA by using the Bio-Rad icycler data analysis software.
Animal Studies.
Male C57BL/6 mice, 8–10 weeks old (Charles River Laboratories) (approved by The Johns Hopkins Animal Care and Use Committee) were anesthetized with ketamine/acepromazine (135/1.5 mg/kg), and the trachea was exposed, cannulated with a 22-gauge angiocath (BD) in a low extrathoracic position, and secured with a suture. A MiniVent (Harvard Apparatus) was used for mechanical ventilation. Hypotonic or isotonic buffer (prewarmed to 32°C; 50 μl) was administered into the upper trachea via an oral route by using a gel loading tip and left in place for 1 h in the presence or absence of RR (10 μM; pretreated 10 min). After euthanizing mice, the trachea proximal to the tracheostomy was removed and stored at −80°C (12, 38).
Calcium Imaging.
Calcium imaging (ref. 23 supporting information) was performed with MLE-12 cells on glass coverslips after incubation at 32°C or 37°C overnight. Cells were rinsed in normal bath solution (see supporting information), loaded with fura-2-acetomethoxy ester (10 μM) and pleuronic acid (0.02%) for 1 h at room temperature (≈25°C), and rinsed again. Solutions were delivered by continuous perfusion (Automate, Oakland, CA). For hypotonic bath solution, NaCl was reduced to 80 mM, then supplemented with 100 mM mannitol to generate isotonic bath solution. For Ca2+-free hypotonic solution, CaCl2 was replaced with 10 mM EGTA before pH and osmotic adjustment. Paired fluorescence images (340 nm and 380 nm excitation, 510 nm emission) were acquired at 2- to 10-s intervals by using an upright microscope (Nikan, Mellville, NY), and emission ratios (340/380 nm) were calculated. Cells (150–250 per coverslip) were randomly selected for analysis. Baseline fura ratios were calculated from the average of 10 images acquired immediately before hypotonic 4α-PDD or RR application (see supporting information). Responding cells were defined as the percentage of cells with maximum fura ratio increases >0.1, and the average response values were calculated from only these responding cells.
Supplementary Material
Acknowledgments
This work was supported by National Heart, Lung, and Blood Institute (NHLBI) National Research Service Award F32HL074515 (to V.K.S.); National Institute of Neurological Disorders and Stroke Grant 1 RO1 NS051551-01 and a Searle Scholars Award (to M.J.C.); and NHLBI Grant R01 HL 70217, American Heart Association Grant-in-Aid AHA-0255234N, and a Flight Attendant Medical Research Institute award (to L.S.K.).
Abbreviations
- AQP
aquaporin
- TRPV4
transient receptor potential vanilloid 4
- 4α-PDD
4α-phorbol 12,13-didecanoate
- EGFR
EGF receptor
- RR
ruthenium red
- HEK
human embryonic kidney
- ASL
airway surface liquid
- MLE
mouse lung epithelial
- mosM
milliosmolar.
Footnotes
Conflict of interest statement: No conflicts declared.
References
- 1.King L. S., Kozono D., Agre P. Nat. Rev. Mol. Cell Biol. 2004;5:687–698. doi: 10.1038/nrm1469. [DOI] [PubMed] [Google Scholar]
- 2.Raina S., Preston G. M., Guggino W. B., Agre P. J. Biol. Chem. 1995;270:1908–1912. doi: 10.1074/jbc.270.4.1908. [DOI] [PubMed] [Google Scholar]
- 3.Nielsen S., King L. S., Christensen B. M., Agre P. Am. J. Physiol. 1997;273:C1549–C1561. doi: 10.1152/ajpcell.1997.273.5.C1549. [DOI] [PubMed] [Google Scholar]
- 4.Kreda S. M., Gynn M. C., Fenstermacher D. A., Boucher R. C., Gabriel S. E. Am. J. Respir. Cell Mol. Biol. 2001;24:224–234. doi: 10.1165/ajrcmb.24.3.4367. [DOI] [PubMed] [Google Scholar]
- 5.Burghardt B., Elkaer M. L., Kwon T. H., Racz G. Z., Varga G., Steward M. C., Nielsen S. Gut. 2003;52:1008–1016. doi: 10.1136/gut.52.7.1008. [DOI] [PMC free article] [PubMed] [Google Scholar]
- 6.Krane C. M., Melvin J. E., Nguyen H. V., Richardson L., Towne J. E., Doetschman T., Menon A. G. J. Biol. Chem. 2001;276:23413–23420. doi: 10.1074/jbc.M008760200. [DOI] [PubMed] [Google Scholar]
- 7.Dobbs L. G., Gonzalez R., Matthay M. A., Carter E. P., Allen L., Verkman A. S. Proc. Natl. Acad. Sci. USA. 1998;95:2991–2996. doi: 10.1073/pnas.95.6.2991. [DOI] [PMC free article] [PubMed] [Google Scholar]
- 8.Towne J. E., Krane C. M., Bachurski C. J., Menon A. G. J. Biol. Chem. 2001;276:18657–18664. doi: 10.1074/jbc.M100322200. [DOI] [PubMed] [Google Scholar]
- 9.Towne J. E., Harrod K. S., Krane C. M., Menon A. G. Am. J. Respir. Cell Mol. Biol. 2000;22:34–44. doi: 10.1165/ajrcmb.22.1.3818. [DOI] [PubMed] [Google Scholar]
- 10.Yang F., Kawedia J. D., Menon A. G. J. Biol. Chem. 2003;278:32173–32180. doi: 10.1074/jbc.M305149200. [DOI] [PubMed] [Google Scholar]
- 11.Sidhaye V., Hoffert J. D., King L. S. J. Biol. Chem. 2005;280:3590–3596. doi: 10.1074/jbc.M411038200. [DOI] [PMC free article] [PubMed] [Google Scholar]
- 12.Hoffert J. D., Leitch V., Agre P., King L. S. J. Biol. Chem. 2000;275:9070–9077. doi: 10.1074/jbc.275.12.9070. [DOI] [PubMed] [Google Scholar]
- 13.Herrlich A., Leitch V., King L. S. Proc. Natl. Acad. Sci. USA. 2004;101:15799–15804. doi: 10.1073/pnas.0406853101. [DOI] [PMC free article] [PubMed] [Google Scholar]
- 14.Jenq W., Cooper D. R., Bittle P., Ramirez G. Biochem. Biophys. Res. Commun. 1999;256:240–248. doi: 10.1006/bbrc.1999.0306. [DOI] [PubMed] [Google Scholar]
- 15.Umenishi F., Yoshihara S., Narikiyo T., Schrier R. W. J. Am. Soc. Nephrol. 2005;16:600–607. doi: 10.1681/ASN.2004030241. [DOI] [PubMed] [Google Scholar]
- 16.Leitch V., Agre P., King L. S. Proc. Natl. Acad. Sci. USA. 2001;98:2894–2898. doi: 10.1073/pnas.041616498. [DOI] [PMC free article] [PubMed] [Google Scholar]
- 17.Sugiyama Y., Ota Y., Hara M., Inoue S. Biochim. Biophys. Acta. 2001;1522:82–88. doi: 10.1016/s0167-4781(01)00320-7. [DOI] [PubMed] [Google Scholar]
- 18.Matsuzaki T., Suzuki T., Takata K. Am. J. Physiol. Cell Physiol. 2001;281:C55–63. doi: 10.1152/ajpcell.2001.281.1.C55. [DOI] [PubMed] [Google Scholar]
- 19.Li Y. H., Sun S. Q. Zhongguo Wei Zhong Bing Ji Jiu Yi Xue. 2004;16:210–213. [PubMed] [Google Scholar]
- 20.Arima H., Yamamoto N., Sobue K., Umenishi F., Tada T., Katsuya H., Asai K. J. Biol. Chem. 2003;278:44525–44534. doi: 10.1074/jbc.M304368200. [DOI] [PubMed] [Google Scholar]
- 21.Gunthorpe M. J., Benham C. D., Randall A., Davis J. B. Trends Pharmacol. Sci. 2002;23:183–191. doi: 10.1016/s0165-6147(02)01999-5. [DOI] [PubMed] [Google Scholar]
- 22.Delany N. S., Hurle M., Facer P., Alnadaf T., Plumpton C., Kinghorn I., See C. G., Costigan M., Anand P., Woolf C. J., et al. Physiol. Genomics. 2001;4:165–174. doi: 10.1152/physiolgenomics.2001.4.3.165. [DOI] [PubMed] [Google Scholar]
- 23.Guler A. D., Lee H., Iida T., Shimizu I., Tominaga M., Caterina M. J. Neurosci. 2002;22:6408–6414. doi: 10.1523/JNEUROSCI.22-15-06408.2002. [DOI] [PMC free article] [PubMed] [Google Scholar]
- 24.Liedtke W., Choe Y., Marti-Renom M. A., Bell A. M., Denis C. S., Sali A., Hudspeth A. J., Friedman J. M., Heller S. Cell. 2000;103:525–535. doi: 10.1016/s0092-8674(00)00143-4. [DOI] [PMC free article] [PubMed] [Google Scholar]
- 25.Nilius B., Prenen J., Wissenbach U., Bodding M., Droogmans G. Pflügers Arch. 2001;443:227–233. doi: 10.1007/s004240100676. [DOI] [PubMed] [Google Scholar]
- 26.Strotmann R., Harteneck C., Nunnenmacher K., Schultz G., Plant T. D. Nat. Cell Biol. 2000;2:695–702. doi: 10.1038/35036318. [DOI] [PubMed] [Google Scholar]
- 27.Wissenbach U., Bodding M., Freichel M., Flockerzi V. FEBS Lett. 2000;485:127–134. doi: 10.1016/s0014-5793(00)02212-2. [DOI] [PubMed] [Google Scholar]
- 28.Nilius B., Vriens J., Prenen J., Droogmans G., Voets T. Am J. Physiol. Cell Physiol. 2004;286:C195–205. doi: 10.1152/ajpcell.00365.2003. [DOI] [PubMed] [Google Scholar]
- 29.Tominaga M., Caterina M. J. J. Neurobiol. 2004;61:3–12. doi: 10.1002/neu.20079. [DOI] [PubMed] [Google Scholar]
- 30.Knowles M., Gatzy J., Boucher R. N. Engl. J. Med. 1981;305:1489–1495. doi: 10.1056/NEJM198112173052502. [DOI] [PubMed] [Google Scholar]
- 31.Boucher R. C., Stutts M. J., Bromberg P. A., Gatzy J. T. J. Appl. Physiol. 1981;50:613–620. doi: 10.1152/jappl.1981.50.3.613. [DOI] [PubMed] [Google Scholar]
- 32.Matsui H., Davis C. W., Tarran R., Boucher R. C. J. Clin. Invest. 2000;105:1419–1427. doi: 10.1172/JCI4546. [DOI] [PMC free article] [PubMed] [Google Scholar]
- 33.Kippenberger S., Loitsch S., Guschel M., Muller J., Kaufmann R., Bernd A. FEBS Lett. 2005;579:207–214. doi: 10.1016/j.febslet.2004.11.077. [DOI] [PubMed] [Google Scholar]
- 34.Hwang T. H., Schwiebert E. M., Guggino W. B. Am. J. Physiol. 1996;270:C1611–C1623. doi: 10.1152/ajpcell.1996.270.6.C1611. [DOI] [PubMed] [Google Scholar]
- 35.Homolya L., Watt W. C., Lazarowski E. R., Koller B. H., Boucher R. C. J. Biol. Chem. 1999;274:26454–26460. doi: 10.1074/jbc.274.37.26454. [DOI] [PubMed] [Google Scholar]
- 36.Watanabe H., Davis J. B., Smart D., Jerman J. C., Smith G. D., Hayes P., Vriens J., Cairns W., Wissenbach U., et al. J. Biol. Chem. 2002;277:13569–13577. doi: 10.1074/jbc.M200062200. [DOI] [PubMed] [Google Scholar]
- 37.Watanabe H., Vriens J., Prenen J., Droogmans G., Voets T., Nilius B. Nature. 2003;424:434–438. doi: 10.1038/nature01807. [DOI] [PubMed] [Google Scholar]
- 38.King L. S., Nielsen S., Agre P. Am. J. Physiol. 1997;273:C1541–C1548. doi: 10.1152/ajpcell.1997.273.5.C1541. [DOI] [PubMed] [Google Scholar]
- 39.Suzuki M., Hirao A., Mizuno A. J. Biol. Chem. 2003;278:51448–51453. doi: 10.1074/jbc.M308212200. [DOI] [PubMed] [Google Scholar]
- 40.Jia Y., Wang X., Varty L., Rizzo C. A., Yang R., Correll C. C., Phelps P. T., Egan R. W., Hey J. A. Am. J. Physiol. Lung Cell. Mol. Physiol. 2004;287:L272–L278. doi: 10.1152/ajplung.00393.2003. [DOI] [PubMed] [Google Scholar]
- 41.Vriens J., Janssens A., Prenen J., Nilius B., Wondergem R. Cell Calcium. 2004;36:19–28. doi: 10.1016/j.ceca.2003.11.006. [DOI] [PubMed] [Google Scholar]
- 42.Kozlova I., Nilsson H., Phillipson M., Riederer B., Seidler U., Colledge W. H., Roomans G. M. Am. J. Physiol. Lung Cell. Mol. Physiol. 2005;288:L874–L878. doi: 10.1152/ajplung.00303.2004. [DOI] [PubMed] [Google Scholar]
- 43.Nilsson H., Kozlova I., Vanthanouvong V., Roomans G. M. Micron. 2004;35:701–705. doi: 10.1016/j.micron.2004.03.005. [DOI] [PubMed] [Google Scholar]
- 44.Vanthanouvong V., Kozlova I., Roomans G. M. Microsc. Res. Tech. 2005;68:6–12. doi: 10.1002/jemt.20217. [DOI] [PubMed] [Google Scholar]
- 45.Jayaraman S., Song Y., Verkman A. S. J. Gen. Physiol. 2001;117:423–430. doi: 10.1085/jgp.117.5.423. [DOI] [PMC free article] [PubMed] [Google Scholar]
- 46.Knowles M. R., Robinson J. M., Wood R. E., Pue C. A., Mentz W. M., Wager G. C., Gatzy J. T., Boucher R. C. J. Clin. Invest. 1997;100:2588–2595. doi: 10.1172/JCI119802. [DOI] [PMC free article] [PubMed] [Google Scholar]
- 47.Okada Y., Maeno E., Shimizu T., Dezaki K., Wang J., Morishima S. J. Physiol. (London) 2001;532:3–16. doi: 10.1111/j.1469-7793.2001.0003g.x. [DOI] [PMC free article] [PubMed] [Google Scholar]
- 48.Verkman A. S. Exp. Eye Res. 2003;76:137–143. doi: 10.1016/s0014-4835(02)00303-2. [DOI] [PubMed] [Google Scholar]
- 49.Becker D., Blase C., Bereiter-Hahn J., Jendrach M. J. Cell Sci. 2005;118:2435–2440. doi: 10.1242/jcs.02372. [DOI] [PubMed] [Google Scholar]
- 50.Watanabe H., Vriens J., Suh S. H., Benham C. D., Droogmans G., Nilius B. J. Biol. Chem. 2002;277:47044–47051. doi: 10.1074/jbc.M208277200. [DOI] [PubMed] [Google Scholar]
- 51.Andrade Y. N., Fernandes J., Vazquez E., Fernandez-Fernandez J. M., Arniges M., Sanchez T. M., Villalon M., Valverde M. A. J. Cell Biol. 2005;168:869–874. doi: 10.1083/jcb.200409070. [DOI] [PMC free article] [PubMed] [Google Scholar]
- 52.Liedtke W., Simon S. A. Am. J. Physiol. Lung Cell. Mol. Physiol. 2004;287:L269–L271. doi: 10.1152/ajplung.00153.2004. [DOI] [PubMed] [Google Scholar]
- 53.Anderson S. D., Holzer K. J. Allergy Clin. Immunol. 2000;106:419–428. doi: 10.1067/mai.2000.108914. [DOI] [PubMed] [Google Scholar]
- 54.Song Y., Verkman A. S. J. Biol. Chem. 2001;276:41288–41292. doi: 10.1074/jbc.M107257200. [DOI] [PubMed] [Google Scholar]
- 55.Steinfeld S., Cogan E., King L. S., Agre P., Kiss R., Delporte C. Lab. Invest. 2001;81:143–148. doi: 10.1038/labinvest.3780221. [DOI] [PubMed] [Google Scholar]
- 56.Wikenheiser K. A., Vorbroker D. K., Rice W. R., Clark J. C., Bachurski C. J., Oie H. K., Whitsett J. A. Proc. Natl. Acad. Sci. USA. 1993;90:11029–11033. doi: 10.1073/pnas.90.23.11029. [DOI] [PMC free article] [PubMed] [Google Scholar]
- 57.Davis J. Q., Bennett V. J. Biol. Chem. 1984;259:13550–13559. [PubMed] [Google Scholar]
- 58.Schmittgen T. D., Zakrajsek B. A., Mills A. G., Gorn V., Singer M. J., Reed M. W. Anal. Biochem. 2000;285:194–204. doi: 10.1006/abio.2000.4753. [DOI] [PubMed] [Google Scholar]
Associated Data
This section collects any data citations, data availability statements, or supplementary materials included in this article.


