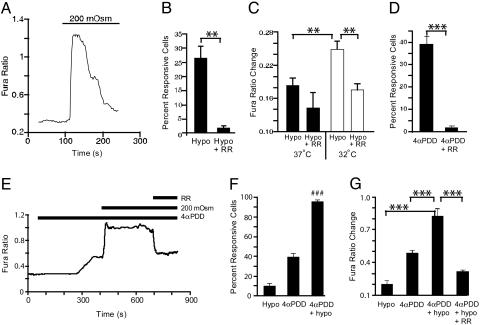
Fig. 7.
Hypotonicity and 4α-PDD increase intracellular Ca2+ in MLE-12 cells. (A) Change in relative intracellular Ca2+, indicated by a change in the fura-2 fluorescence ratio, in a representative MLE-12 cell (incubated overnight at 37°C, then assayed at ≈25°C) during a switch from isotonic (300 mosM) to hypotonic (200 mosM) buffer. (B) Percentage of cells exhibiting a hypotonic-evoked change in fura ratio >0.1 ratio units in the experiment shown in A under control conditions (Hypo), or when ruthenium red (10 μM) was administered 2 min before hypotonic stimulation (Hypo + RR). (C) Amplitude of hypotonic-evoked fura ratio change (among hypotonic-responsive cells) in cells incubated overnight at 32°C versus 37°C. (D) Percentage of cells (incubated overnight at 32°C) responsive to 4α-PDD (10 μM) and inhibition by RR. (E) Representative trace of fura ratio in cells subjected to successive exposure to 200 mosM, 4α-PDD, and RR. (F and G) Percentage of responsive cells (F) and mean fura ratio change (G) after stimulation with hypotonic solution alone versus 4α-PDD alone or a combination of the two. Hypotonic responses were recorded in one set of coverslips, whereas responses to 4α-PDD, 4α-PDD plus hypotonic, and inhibition by ruthenium red were recorded from another set of coverslips treated as in E. Data shown represent mean ± SEM, n = 6. ∗∗, P < 0.01, ∗∗∗, P < 0.001, unpaired (B–D) or paired (G) Student’s t test. (F) ###, P < 0.001 versus sum of individual hypotonic and 4α-PDD responses, unpaired Student’s t test.

