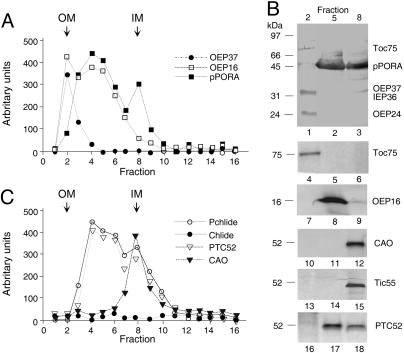
Fig. 2.
CAO is not part of the Ptc complex. (A) Distribution of pPORA, OEP37, and OEP16 in OMs, IMs, and OM–IM junction complexes containing pPORA in barley etiochloroplasts. (B) As in A but showing, in addition, the distribution of Toc75, OEP37, IEP36, and OEP24 in fractions 2, 5, and 8, respectively, on one and the same blot (lanes 1–3) and that of Toc75 (lanes 4–6) and OEP16 (lanes 7–9), as well as CAO (lanes 10–12), Tic55 (lanes 13–15), and Ptc52 (lanes 16–18) on different blots. Each lane contained 10 μg of protein. (C) Pchlide and Chlide levels in relation to Ptc52 and CAO protein levels, respectively, across the gradient.

