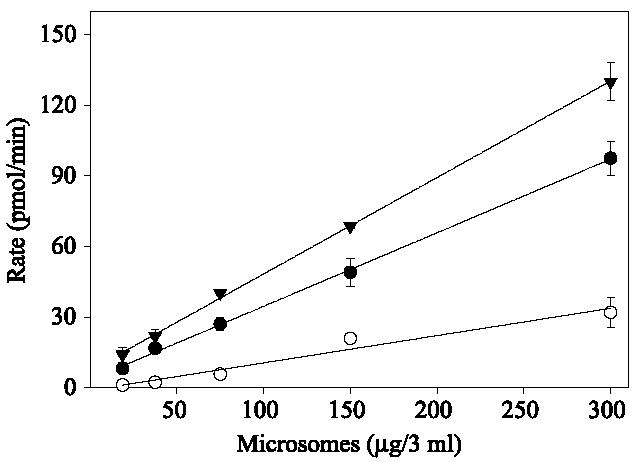
Fig. 3.

Dependence on the observed reaction rate between amount of microsomes and substrates: substrate 2 (▼), substrate 6 ([unk]), and 7-ER (○). Assays were conducted in a final volume of 3 ml with varying concentrations of rat liver microsomes in 40 mM Tris–HCl at pH 7.8 with a final substrate concentration of 33 μM. Assays with substrate 6 (33 μM) were identical except that 0.1 M Hepes (pH 7.8) buffer was used. Data are the means and standard deviations of three replicates.
